

Question: Managers use a to show performance data trends, such as the monthly trends for outpatient dincicisis tabular report line graph ( also called a run
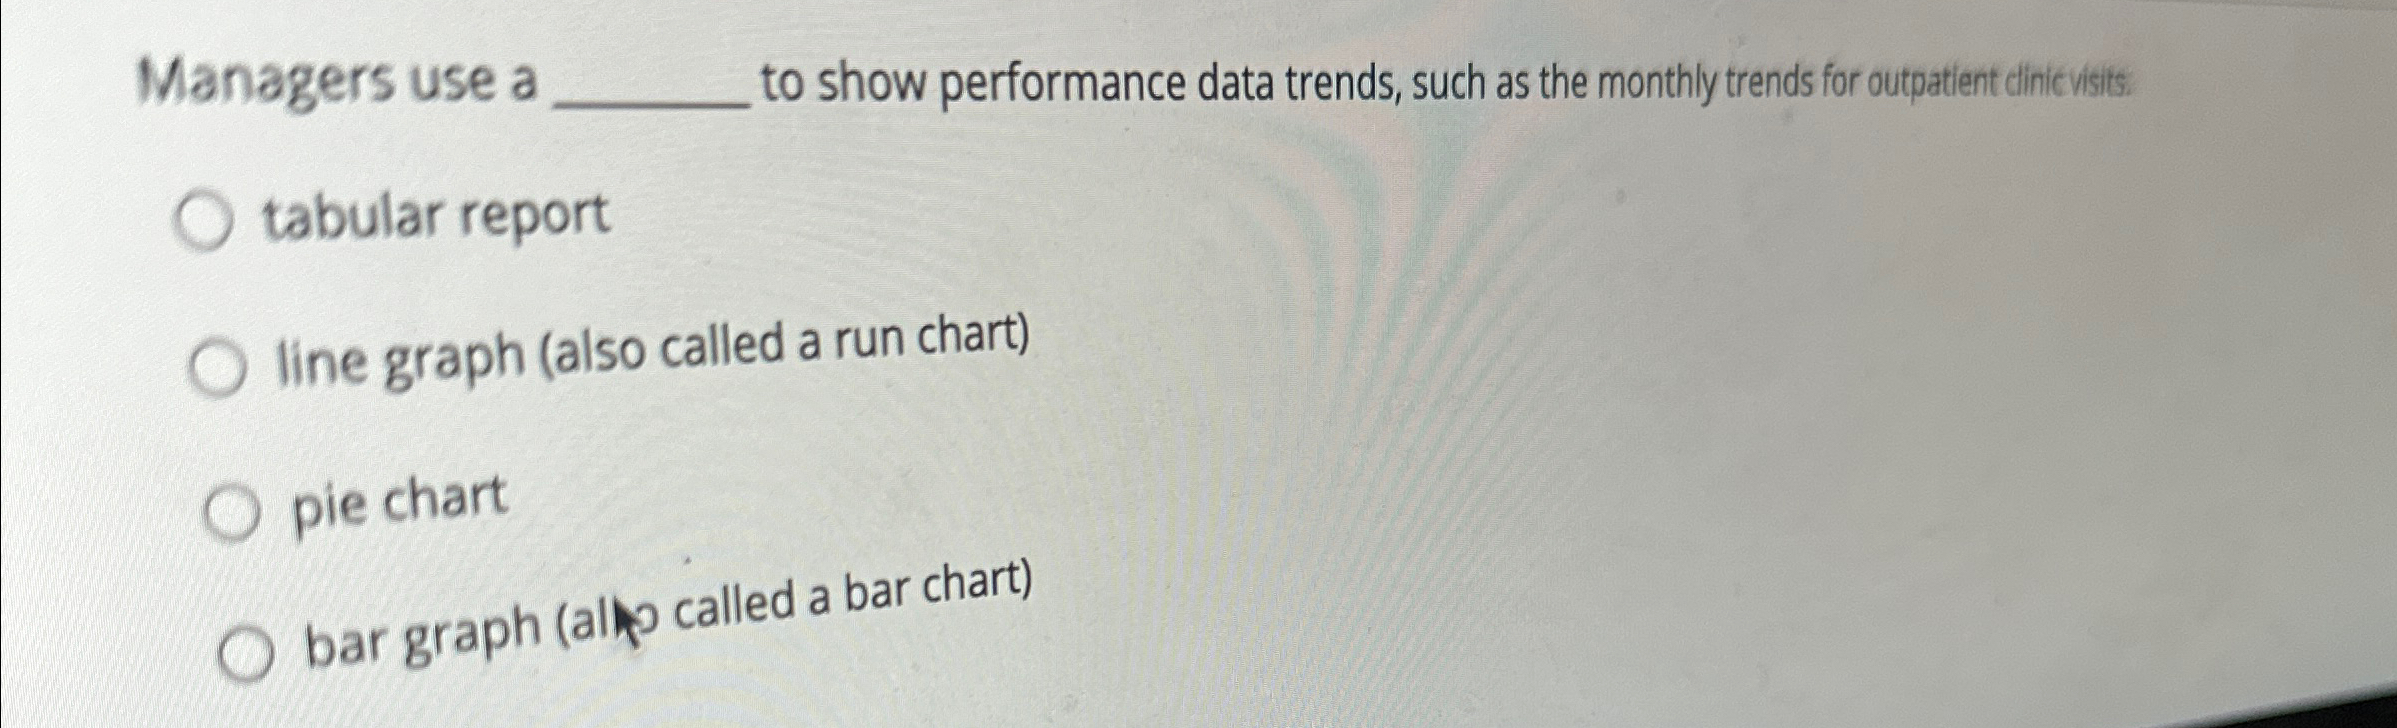
Managers use a to show performance data trends, such as the monthly trends for outpatient dincicisis
tabular report
line graph also called a run chart
pie chart
bar graph allo called a bar chart
Step by Step Solution
There are 3 Steps involved in it
1 Expert Approved Answer
Step: 1 Unlock

Question Has Been Solved by an Expert!
Get step-by-step solutions from verified subject matter experts
Step: 2 Unlock
Step: 3 Unlock