

Question: Maps Registration Term 4 3 - Quiz 1 (Week 3) i Saved I he following data give the weekly amounts spent on groceries for a
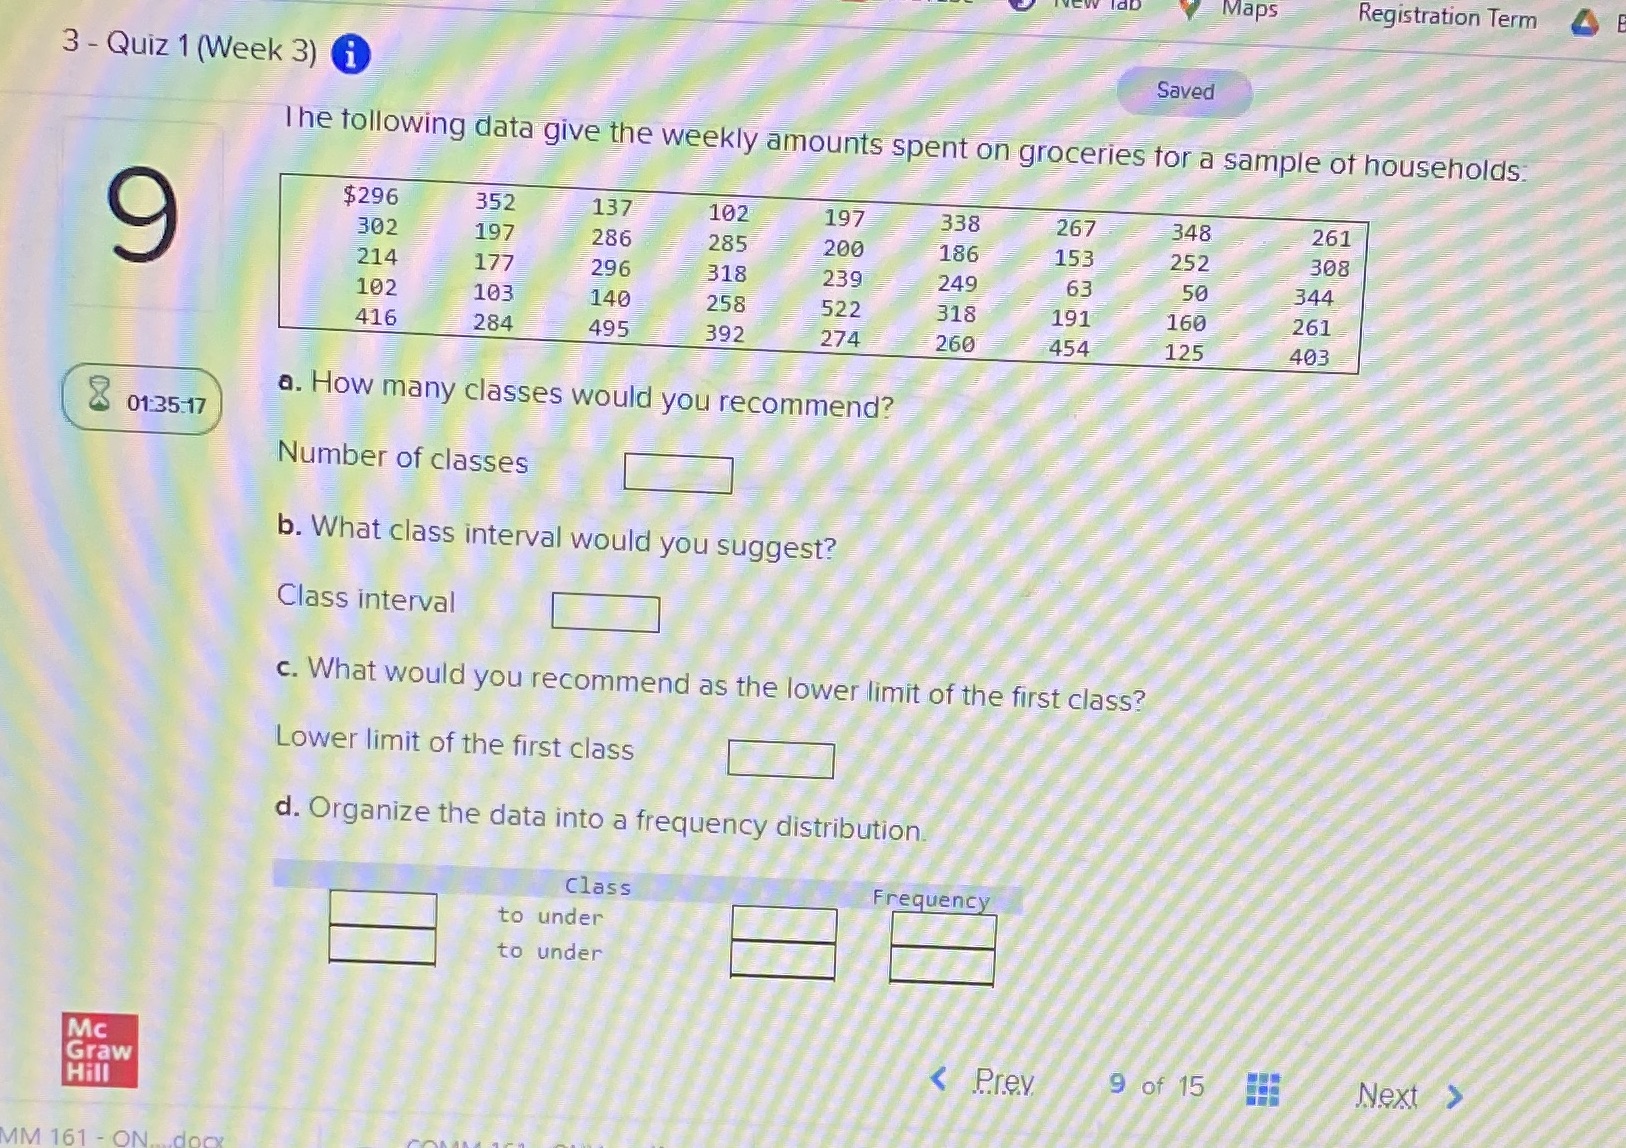
Maps Registration Term 4 3 - Quiz 1 (Week 3) i Saved I he following data give the weekly amounts spent on groceries for a sample of households 9 $296 352 137 102 197 338 267 348 261 302 197 286 285 200 186 153 252 308 214 177 296 318 239 249 63 50 344 102 103 140 258 522 318 191 160 261 416 284 495 392 274 260 454 125 403 01:35:17 a. How many classes would you recommend? Number of classes b. What class interval would you suggest? Class interval c. What would you recommend as the lower limit of the first class? Lower limit of the first class d. Organize the data into a frequency distribution. Class Frequency to under to under Mc Graw Hill AM 161 - ON
Step by Step Solution
There are 3 Steps involved in it

Get step-by-step solutions from verified subject matter experts