

Question: mar Given the graph below, perform a depth first search (DFS) starting from node 8. Show all your working. 5 9 10 2 6
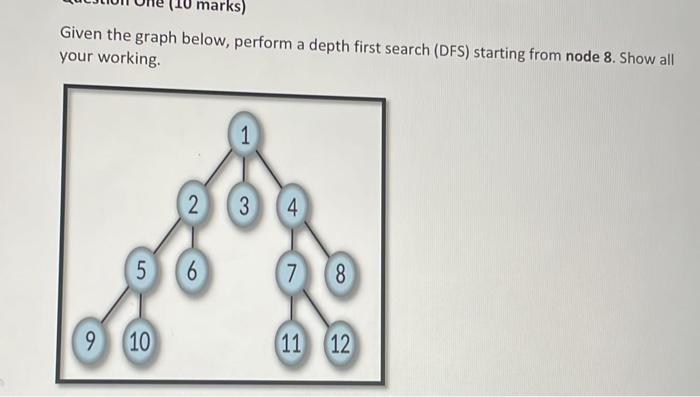
mar Given the graph below, perform a depth first search (DFS) starting from node 8. Show all your working. 5 9 10 2 6 1 3 4 7 8 11 12
Step by Step Solution
There are 3 Steps involved in it
1 Expert Approved Answer
Step: 1 Unlock

DFS uses Stack to store the current node ... View full answer
Question Has Been Solved by an Expert!
Get step-by-step solutions from verified subject matter experts
Step: 2 Unlock
Step: 3 Unlock