

Question: March-September frame snapshot: python-please help asap make_fig_2: This function takes a March-September frame, and creates a figure that looks like the image below. The rubric
March-September frame snapshot:
python-please help asap
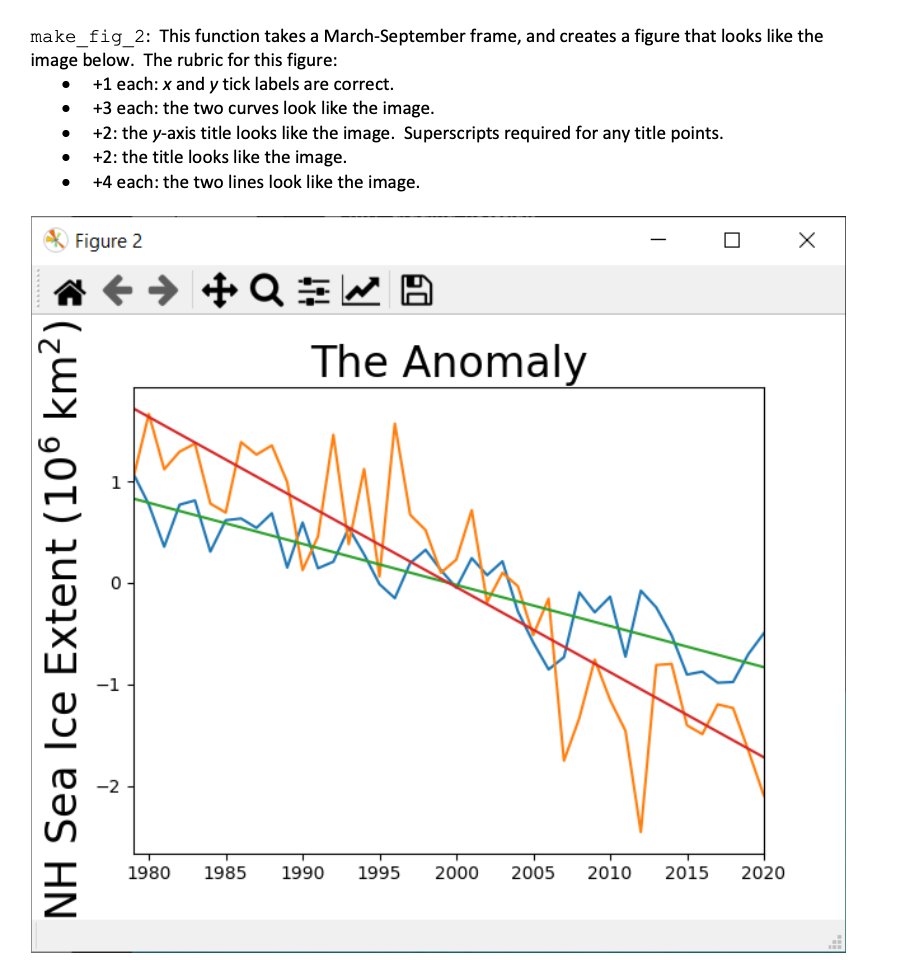
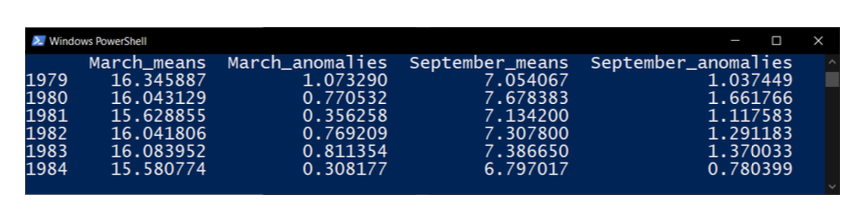
make_fig_2: This function takes a March-September frame, and creates a figure that looks like the image below. The rubric for this figure: +1 each: x and y tick labels are correct. +3 each: the two curves look like the image. +2: the y-axis title looks like the image. Superscripts required for any title points. +2: the title looks like the image. +4 each: the two lines look like the image. . . Figure 2 #QWA The Anomaly NH Sea Ice Extent (106 km2) >> 1980 1985 1990 1995 2000 2000 2005 2010 2015 2020 Windows PowerShell March_means March_anomalies September_means 1979 16.345887 1.073290 7.054067 1980 16.043129 0.770532 7.678383 1981 15.628855 0.356258 7.134200 1982 16.041806 0.769209 7.307800 1983 16.083952 0.811354 7.386650 1984 15.580774 0.308177 6.797017 September_anomalies 1.037449 1.661766 1.117583 1.291183 1.370033 0.780399 make_fig_2: This function takes a March-September frame, and creates a figure that looks like the image below. The rubric for this figure: +1 each: x and y tick labels are correct. +3 each: the two curves look like the image. +2: the y-axis title looks like the image. Superscripts required for any title points. +2: the title looks like the image. +4 each: the two lines look like the image. . . Figure 2 #QWA The Anomaly NH Sea Ice Extent (106 km2) >> 1980 1985 1990 1995 2000 2000 2005 2010 2015 2020 Windows PowerShell March_means March_anomalies September_means 1979 16.345887 1.073290 7.054067 1980 16.043129 0.770532 7.678383 1981 15.628855 0.356258 7.134200 1982 16.041806 0.769209 7.307800 1983 16.083952 0.811354 7.386650 1984 15.580774 0.308177 6.797017 September_anomalies 1.037449 1.661766 1.117583 1.291183 1.370033 0.780399
Step by Step Solution
There are 3 Steps involved in it

Get step-by-step solutions from verified subject matter experts