

Question: Marginal, cost Total prot - Dollars ($) Average; cost Demand Quantity Figure 9.6 Illustrating Prots at the HealthPiil Monopoly This gure begins with the same
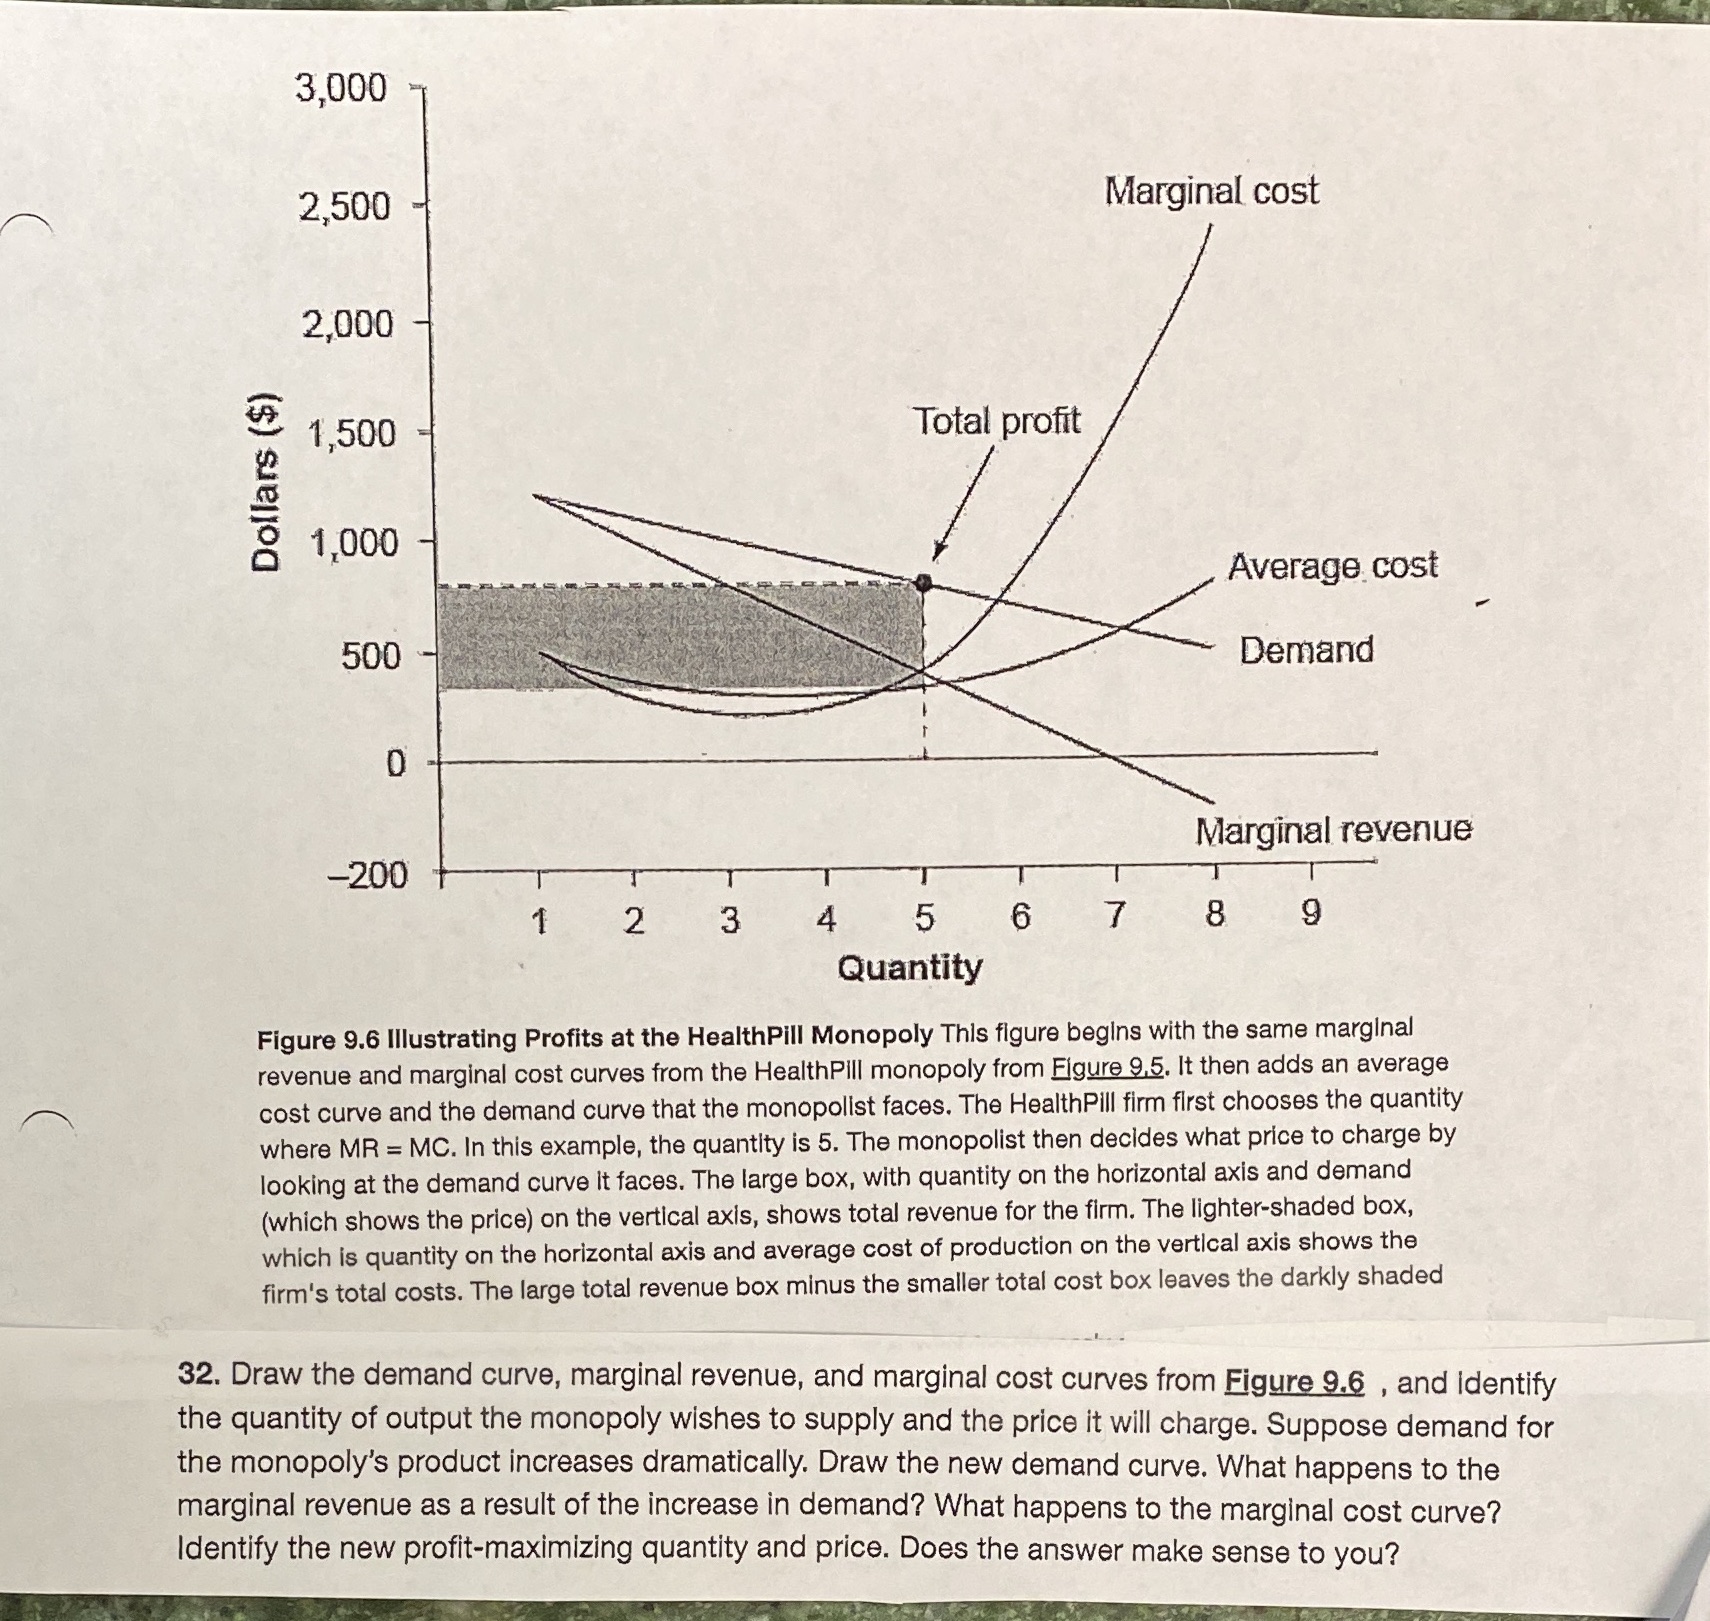
Marginal, cost Total prot - Dollars ($) Average; cost Demand Quantity Figure 9.6 Illustrating Prots at the HealthPiil Monopoly This gure begins with the same marginal revenue and marginal cost curves from the HealthPiii monopoly from 139%. it then adds an average A. cost curve and the demand curve that the monopolist faces. The HealthPlll rm first chooses the quantity where MR = MC. In this example. the quantity is 5. The monopolist then decides what price to charge by looking at the demand curve it faces. The large box, with quantity on the horizontal axis and demand (which shows the price) on the vertical axis. shows total revenue for the firm. The lighter-shaded box, .. - which Is quantity on the horizontal axis and average cost of production on the vertical axis shows the ' rrn'e total costs. The large total revenue box minus the smaller total cost box leaves the darkly shaded 32. Draw the demand curve. marginal revenue. and marginal cost curves from Elguw and identify the quantity of output the monopoly wishes to supply and the price it will charge. Suppose demand for the monopoly's product increases dramatically. Draw the new demand curve. What happens to the marginal revenue as a result of the increase in demand? What happens to the marginal cost curve? identify the new profit-maximizing quantity and price. Does the answer make sense to you
Step by Step Solution
There are 3 Steps involved in it

Get step-by-step solutions from verified subject matter experts