

Question: Markadel Retail Store Income Statement Data From January 1 through December 31, 2012, and 2013 Vertical Analysis 2012 (%) 101.73 Horizontal Analysis 2012- 2013 (%)
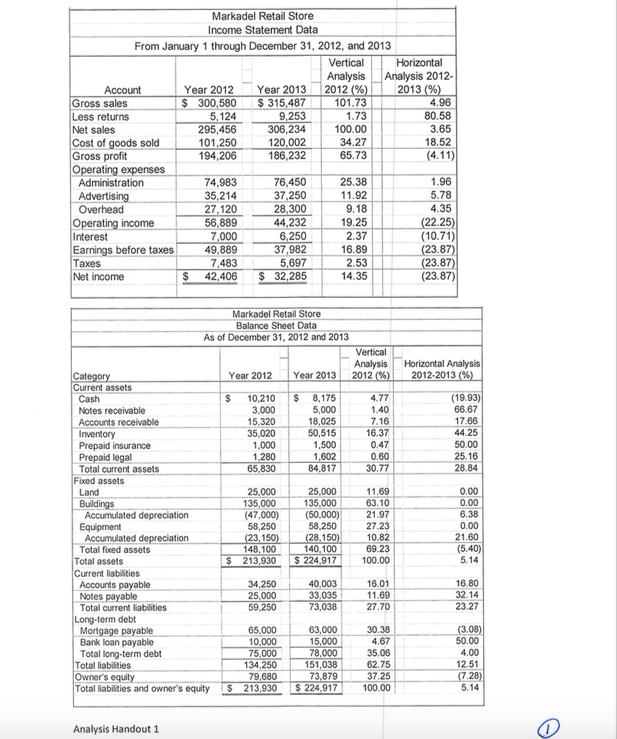
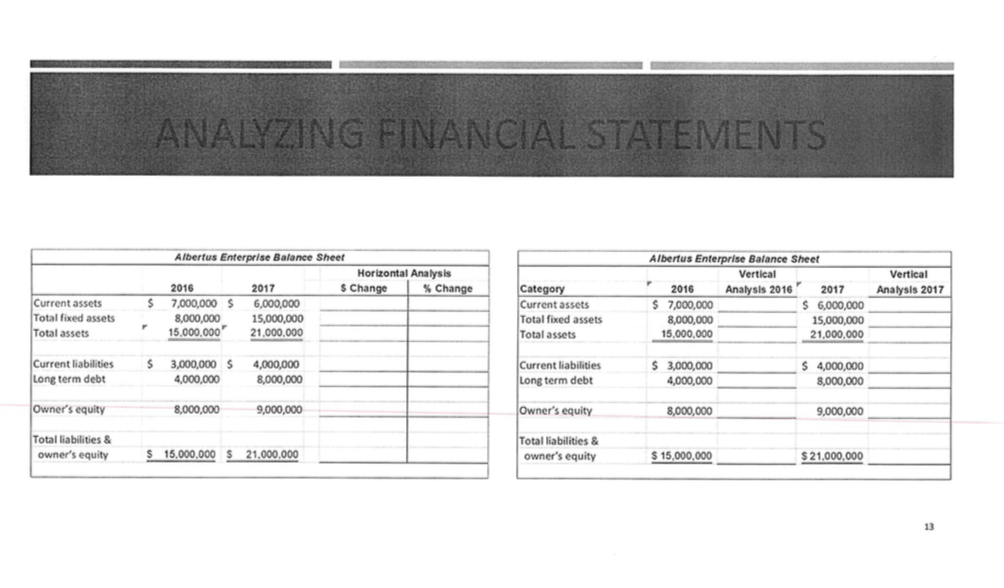
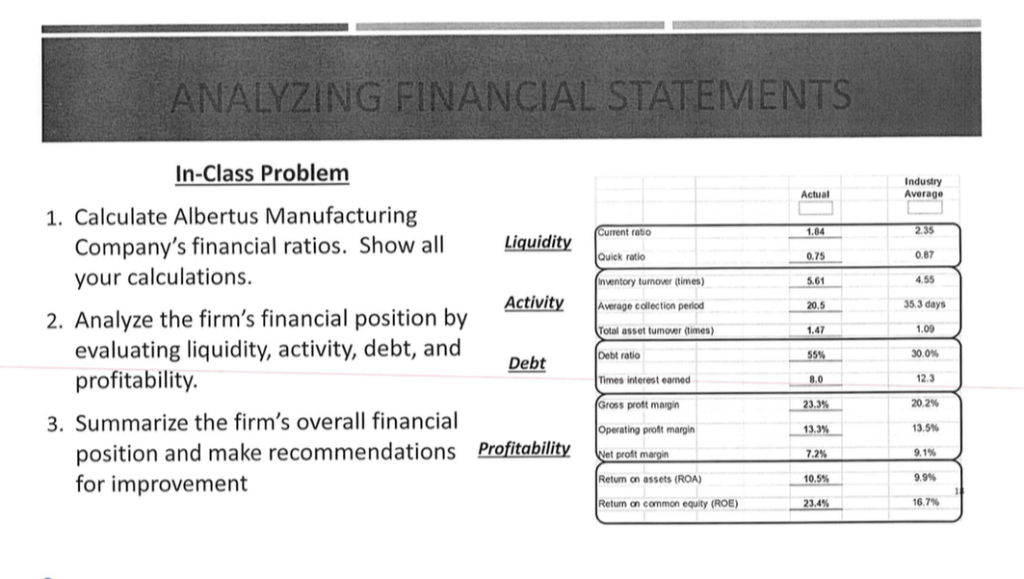
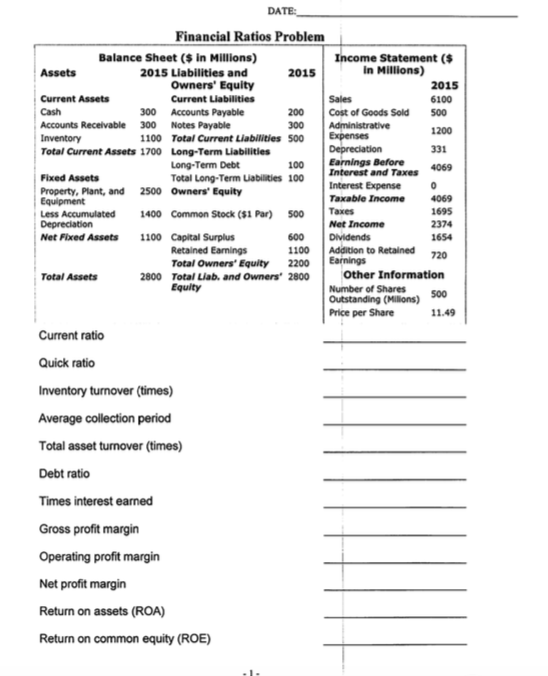
Markadel Retail Store Income Statement Data From January 1 through December 31, 2012, and 2013 Vertical Analysis 2012 (%) 101.73 Horizontal Analysis 2012- 2013 (%) Year 2012 Year 2013 Account Gross sales Less returns Net sales Cost of goods sold Gross profit Operating expenses $ 300,580 5,124 295,456 $315,487 9,253 306,234 120,002 4.96 80.58 3.65 1,73 100.00 101,250 34.27 18.52 194,206 186,232 65.73 (4.11) 76,450 37,250 1.96 74,983 35,214 25.38 Administration Advertising Overhead 11.92 5.78 27,120 56,889 7,000 28,300 44,232 9.18 4.35 Operating income Interest Earnings before taxes Taxes Net income (22.25) (10.71) (23.87) (23.87) 19.25 2,37 6,250 37,982 5,697 $ 32,285 49,889 16.89 2.53 7,483 (23.87) 42,406 14.35 Markadel Retail Store Balance Sheet Data As of December 31, 2012 and 2013 Vertical Horizontal Analysis 2012-2013 (%) Analysis 2012 (%) Category Current assets Cash Notes receivable Accounts receivable Inventory Prepaid insurance Prepaid legal Total current assets Fixed assets Land Buildings Accumulated depreciation Equipment Accumulated depreciation Total foxed assets Total assets Current liabilities Accounts payable Notes payable Total current liabilities Long-term debt Mortgage payable Bank loan payable Total long-term debt Total liabilities Owner's equity Total liabilities and owner's equity Year 2012 Year 2013 10,210 3,000 15,320 35,020 1,000 1,280 S 8,175 5,000 18,025 50,515 1,500 1,602 84,817 4.77 (19.93) 66.67 17.66 44.25 S 1.40 7.16 16.37 50.00 25.16 28.84 0.47 0.60 30.77 65.830 25,000 135,000 (50,000) 58,250 (28.150) 140.100 11.69 63.10 0.00 0.00 25,000 135,000 (47,000) 6.38 21.97 27.23 10.82 69.23 0.00 58.250 21.60 (5.40) 5.14 (23,150) 148,100 224,917 100.00 S 213,930 34,250 25,000 59,250 40,003 33.035 73,038 16.01 16.80 11.69 32.14 23.27 27.70 (3.08) 50.00 65,000 10,000 75,000 134,250 63,000 15,000 78,000 151,038 73,879 S 224,917 30.38 4.67 35.06 4,00 12.51 (7.28) 62.75 37.25 79,680 213,930 100.00 5.14 Analysis Handout 1 ANALYZING FINANCIAL STATEMENTS Albertus Enterprise Balance Sheet Albertus Enterprise Balance Sheet Horizontal Analysis Vertical Vertical $ Change Category 2016 2017 Change 2016 Analysis 2016 2017 Analysis 2017 7,000,000 $ 8,000,000 15,000,000 6,000,000 Current assets Total fixed assets S sets 000 000 15.000.000 Total fixed assets Total assets 8,000,000 15,000,000 21,000,000 Total assets 15.000,000 21,000,000 Current liabilities Long term debt 3,000,000 $ Current liabilities Long term debt S 4,000,000 8,000,000 4,000,000 3,000,000 4,000,000 8,000,000 4,000,000 Owner's equity 8,000,000 9,000,000 Owner's equity 8,000,000 9.000,000 Total liabilities & Total liabilities & owner's equity $ 15,000,000 $ 21,000.000 owner's equity 15,000,000 $21,000,000 13 ANALYZING FINANCIAL STATEMENTS In-Class Problem Industry Average Actual 1. Calculate Albertus Manufacturing 2.35 1.84 Current ratio Company's financial ratios. Show all your calculations. Liquidity Quick ratio 0.87 0.75 4.55 Inventory turnover (times) 5.61 Activity Average callection period 35.3 days 20.5 2. Analyze the firm's financial position by evaluating liquidity, activity, debt, and profitability. Total asset tumover (times) 1.09 1.47 Debt ratio 30.0 % 55% Debt Times interest eamed 12.3 8.0 Gross proft margin 20.2% 23.3% 3. Summarize the firm's overall financial Operating proft margin 13.5% 13.3% position and make recommendations Profitability Net proft margin 9,1% 7.2% Return on assets (ROA) 9.9% for improvement 10.5% 16.7 % Return an common equity (ROE) 23.4% DATE Financial Ratios Problem Income Statement ($ in Millions) Balance Sheet ($ in Millions) 2015 Liabilities and Owners' Equity Assets 2015 2015 Current Assets Current Liabilities Sales 6100 300 Accounts Payable 300 Notes Payable Cash 200 Cost of Goods Sold Administrative Expenses Depreciation Earnings Before Interest and Taxes Interest Expense 500 Accounts Receivable Inventory Total Current Assets 1700 300 1200 1100 Total Current Liabilities 500 331 Long-Term Liabilities Long-Term Debt 100 4069 Fixed Assets Total Long-Term Liabilities 100 2500 Owners' Equity Property, Plant, and Equipment Taxable Income 4069 es 1695 Less Accumulated Depreciation 1400 Common Stock ($1 Par) 500 2374 Net Income Dividends Addition to Retained 720 Earnings Other Information Net Fixed Assets 1100 Capital Surplus 600 1654 Retained Earnings Total Owners Equity Total Liab. and Owners' 2800 1100 2200 Total Assets 2800 Equity Number of Shares Outstanding (Milions) Price per Share 500 11.49 Current ratio Quick ratio Inventory turnover (times) Average collection period Total asset turnover (times) Debt ratio Times interest earned Gross profit margin Operating profit margin Net profit margin Return on assets (ROA) Return on common equity (ROE) Markadel Retail Store Income Statement Data From January 1 through December 31, 2012, and 2013 Vertical Analysis 2012 (%) 101.73 Horizontal Analysis 2012- 2013 (%) Year 2012 Year 2013 Account Gross sales Less returns Net sales Cost of goods sold Gross profit Operating expenses $ 300,580 5,124 295,456 $315,487 9,253 306,234 120,002 4.96 80.58 3.65 1,73 100.00 101,250 34.27 18.52 194,206 186,232 65.73 (4.11) 76,450 37,250 1.96 74,983 35,214 25.38 Administration Advertising Overhead 11.92 5.78 27,120 56,889 7,000 28,300 44,232 9.18 4.35 Operating income Interest Earnings before taxes Taxes Net income (22.25) (10.71) (23.87) (23.87) 19.25 2,37 6,250 37,982 5,697 $ 32,285 49,889 16.89 2.53 7,483 (23.87) 42,406 14.35 Markadel Retail Store Balance Sheet Data As of December 31, 2012 and 2013 Vertical Horizontal Analysis 2012-2013 (%) Analysis 2012 (%) Category Current assets Cash Notes receivable Accounts receivable Inventory Prepaid insurance Prepaid legal Total current assets Fixed assets Land Buildings Accumulated depreciation Equipment Accumulated depreciation Total foxed assets Total assets Current liabilities Accounts payable Notes payable Total current liabilities Long-term debt Mortgage payable Bank loan payable Total long-term debt Total liabilities Owner's equity Total liabilities and owner's equity Year 2012 Year 2013 10,210 3,000 15,320 35,020 1,000 1,280 S 8,175 5,000 18,025 50,515 1,500 1,602 84,817 4.77 (19.93) 66.67 17.66 44.25 S 1.40 7.16 16.37 50.00 25.16 28.84 0.47 0.60 30.77 65.830 25,000 135,000 (50,000) 58,250 (28.150) 140.100 11.69 63.10 0.00 0.00 25,000 135,000 (47,000) 6.38 21.97 27.23 10.82 69.23 0.00 58.250 21.60 (5.40) 5.14 (23,150) 148,100 224,917 100.00 S 213,930 34,250 25,000 59,250 40,003 33.035 73,038 16.01 16.80 11.69 32.14 23.27 27.70 (3.08) 50.00 65,000 10,000 75,000 134,250 63,000 15,000 78,000 151,038 73,879 S 224,917 30.38 4.67 35.06 4,00 12.51 (7.28) 62.75 37.25 79,680 213,930 100.00 5.14 Analysis Handout 1 ANALYZING FINANCIAL STATEMENTS Albertus Enterprise Balance Sheet Albertus Enterprise Balance Sheet Horizontal Analysis Vertical Vertical $ Change Category 2016 2017 Change 2016 Analysis 2016 2017 Analysis 2017 7,000,000 $ 8,000,000 15,000,000 6,000,000 Current assets Total fixed assets S sets 000 000 15.000.000 Total fixed assets Total assets 8,000,000 15,000,000 21,000,000 Total assets 15.000,000 21,000,000 Current liabilities Long term debt 3,000,000 $ Current liabilities Long term debt S 4,000,000 8,000,000 4,000,000 3,000,000 4,000,000 8,000,000 4,000,000 Owner's equity 8,000,000 9,000,000 Owner's equity 8,000,000 9.000,000 Total liabilities & Total liabilities & owner's equity $ 15,000,000 $ 21,000.000 owner's equity 15,000,000 $21,000,000 13 ANALYZING FINANCIAL STATEMENTS In-Class Problem Industry Average Actual 1. Calculate Albertus Manufacturing 2.35 1.84 Current ratio Company's financial ratios. Show all your calculations. Liquidity Quick ratio 0.87 0.75 4.55 Inventory turnover (times) 5.61 Activity Average callection period 35.3 days 20.5 2. Analyze the firm's financial position by evaluating liquidity, activity, debt, and profitability. Total asset tumover (times) 1.09 1.47 Debt ratio 30.0 % 55% Debt Times interest eamed 12.3 8.0 Gross proft margin 20.2% 23.3% 3. Summarize the firm's overall financial Operating proft margin 13.5% 13.3% position and make recommendations Profitability Net proft margin 9,1% 7.2% Return on assets (ROA) 9.9% for improvement 10.5% 16.7 % Return an common equity (ROE) 23.4% DATE Financial Ratios Problem Income Statement ($ in Millions) Balance Sheet ($ in Millions) 2015 Liabilities and Owners' Equity Assets 2015 2015 Current Assets Current Liabilities Sales 6100 300 Accounts Payable 300 Notes Payable Cash 200 Cost of Goods Sold Administrative Expenses Depreciation Earnings Before Interest and Taxes Interest Expense 500 Accounts Receivable Inventory Total Current Assets 1700 300 1200 1100 Total Current Liabilities 500 331 Long-Term Liabilities Long-Term Debt 100 4069 Fixed Assets Total Long-Term Liabilities 100 2500 Owners' Equity Property, Plant, and Equipment Taxable Income 4069 es 1695 Less Accumulated Depreciation 1400 Common Stock ($1 Par) 500 2374 Net Income Dividends Addition to Retained 720 Earnings Other Information Net Fixed Assets 1100 Capital Surplus 600 1654 Retained Earnings Total Owners Equity Total Liab. and Owners' 2800 1100 2200 Total Assets 2800 Equity Number of Shares Outstanding (Milions) Price per Share 500 11.49 Current ratio Quick ratio Inventory turnover (times) Average collection period Total asset turnover (times) Debt ratio Times interest earned Gross profit margin Operating profit margin Net profit margin Return on assets (ROA) Return on common equity (ROE)
Step by Step Solution
There are 3 Steps involved in it

Get step-by-step solutions from verified subject matter experts