

Question: Martha manages a home improvement store and uses this function to model the number of customers that visit the store each hour on Saturday
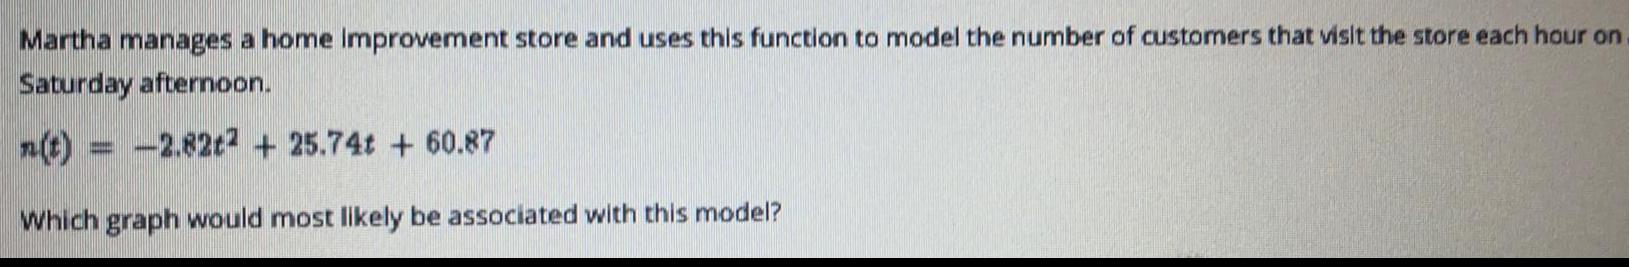
Martha manages a home improvement store and uses this function to model the number of customers that visit the store each hour on Saturday afternoon. n(t) = -2.82t2 + 25.74 + 60.87 Which graph would most likely be associated with this model?
Step by Step Solution
There are 3 Steps involved in it
1 Expert Approved Answer
Step: 1 Unlock

Question Has Been Solved by an Expert!
Get step-by-step solutions from verified subject matter experts
Step: 2 Unlock
Step: 3 Unlock