

Question: MAS183 Statistical Data Analysis 1 Project Description give 2 examples for this question so that i can choose one question for my assignment THIS
MAS183 Statistical Data Analysis
1 Project Description
"give 2 examples for this question so that i can choose one question for my assignment"
"THIS IS THE ACTUAL QUESTION PROVIDE ME WITH ATLEAST 2 ANSWERS"
For the project you should choose a problem that is relevant to your subject area or that you have an interest in. It is acceptable to choose a problem that you think you already know the answer to - you will not be marked according to whether you have made any wonderful discoveries (or not) but according to your statistical presentation and methodological skills. Examples are included below. However, you should think of your own problem to investigate and you should collect your own data. If you find it necessary to use someone else's problem or data for a project (not recommended), make sure you acknowledge the source in an appropriate way (to avoid When choosing your project try to keep it simple, or at least choose a project that will not require too much time to collect the data (perhaps by choosing something that you normally give anyway, such as cooking, driving, etc.). It is better to perform and document a relatively simple project well than to attempt an extremely ambitious project poorly. However, do not be discouraged from using statistics beyond the statistics we cover in MAS183. The project consists of the following steps (note this is what you need to do - see the marking guide below for how you should present your project): 1. Choose a fairly specific problem that you would like to investigate (see examples below). State this as a research question. 2. give a specific hypotheses that you would like to test. If there are any assumptions you feel you will need to make to address your problem (or wish to make to simplify the problem) note these also. 3. Describe the data that you intend to collect. Describe as precisely as you can in preparation for collecting the data and think about sampling and how to ensure the data you collect is consistent. 4. Think about how you intend to use your data to examine your hypotheses (for example, what type of statistical test do you intend to use). 5. Collect the data. Note any problems encountered whilst collecting the data or any changes that need to be made to your original intended method of collection. Keep a copy the data. 6. Describe the data and use it to address your problem. a. Use descriptive statistics and visualisation(s) to present key features of the data. b. Perform a suitable hypothesis test and/or calculate a confidence interval. Make sure your data is consistent with the assumptions of your statistical method. If you encounter inconsistencies, try to get around the problem. If this is not possible you should briefly discuss the inconsistency. 7. Give the outcome of the analysis and draw a conclusion based on your data.
The final project will be marked out of 20. You should include the following sections: ? Executive summary or abstract o Summarise the project and it's key outcomes ? Introduction and data collection o Detail the research question o Detail the data collection and any limitations ? Methods o Detail the statistical technique selected with a justification o If using a hypothesis test detail the null and alternative hypothesis o Assumptions ? Analysis o Visualise the data o Report the statistical analysis ? Conclusion o State the results of the analysis in the context of the research question o State any limitations of the project Notes: ? those marking the project will have the discretion to award bonus marks for exceptional work (for example an informed discussion of several limitations could be awarded a bonus mark) ? inconsistencies between sections will result in a deduction of marks
"THE GUIDELINES"
Here are some guidelines as to how the marks will be given [0/1/2 per section]: ? Executive Summary or Abstract: Overview of the project with key results and conclusion 0. No executive summary or abstract 1. Simple summary but missing some details or poorly written 2. Executive Summary or Abstract contains an overview of the project, key results from the analysis and a conclusion. ? Introduction: An overview of the research question or project aim. 0. Research question or project aim poorly described 1. Simple question adequately described. 2. Sophisticated research question or project aim ? Data collection process: A description of the data collected (or obtained) and how it was collected (or obtained). 0. Data collection method unclear 1. Data collection appropriate and adequately described (another student could repeat the project). 2. Data collection appropriate and adequately described with limitations of the approach detailed ? Visualisation: The data should be visualised with an appropriate visualisation and a comment should accompany it that discusses the features of the visualisation. 0. Inappropriate visualisation and/or no comment. 1. Simple, suitable visualisation and associated comment. 2. Suitable, clean visualisation with title, labels (including units) and accompanying comment that demonstrates an understanding of the data as presented in the visualisation. ? Methods: A suitable statistical technique should be selected. 0. Inappropriate analysis or no statistical technique used. 1. Appropriate statistical technique selected. 2. Appropriate statistical technique selected with justification. ? Assumptions: A assumptions detailed and check. 0. No assumptions addressed or incorrect assumptions given the technique 1. Assumptions described correctly. 2. Assumptions described correctly and checked. ? Analysis: A suitable hypothesis test and/or confidence interval should be presented. 0. Inappropriate analysis or presentation of R code with no explanation 1. Hypothesis test or confidence interval stated or carried out correctly. 2. Hypothesis test or confidence interval stated and carried out correctly with good notation. ? Conclusion: There should be a carefully worded conclusion that puts the ingredients (population, characteristic of interest in the population, sampling mechanism and data collected) together in a coherent and sensible way. 0. Conclusion that makes a statement about a population that is different to the population that was sampled, sample treated as a population 1. Conclusion is suitable and brings together the research question or project aim and information collected and analysed in the project. Understanding of populations and samples demonstrated. 2. Conclusion brings together the research question or project aim and information collected and analysed in the project. Understanding of populations and samples demonstrated. Limitations and/or recommendations for future project described. ? Appendix: A technical appendix included 0. No appendix 1. Appendix includes data or analysis (e.g output from R or Excel) 2. Appendix includes data and analysis ? Communication: Good layout, good writing (grammar, spelling, reads well) 0. Poor layout 1. Simple report but missing some details or poorly written or poorly structured 2. Report is easy to follow and readable
"PROJECT IDEAS"
3 Project ideas Below are some examples of simple projects. Successful completion of a project similar to the Okay or Excellent Project will result in at least 50% of the marks for the project. High distinction marks (greater than 80%) will only be achieved on a simple project if it is of an impeccable quality. (Note that only one test is expected, ie. one null hypothesis.) Example research questions 1. Do I, on average hit a golf ball further with a driver than with a 3-iron when teeing off in golf? (Data from 15 hits each). 2. Of two possible routes that can be taken to drive to work, is one route quicker on average than the other? (Data from 10 times each). 3. Is the X section of carpark Y at Murdoch University full more than 50% of the time when I arrive at Murdoch University in the morning? (Data from 20 arrivals) If you are more ambitious, you could modify these simple projects. You are under no obligation to get it
but will be rewarded with "high distinction" marks if you get it successfully. In most of these cases you will need to collect more data. 1. Try three or four different golf clubs (or maybe investigate whether it makes any difference if it is raining). 2. Does the best route depend on the day of the week or time you leave?
"JUST EXAMPLE"
Example report one Author: Ross Taplin For our project we decided to investigate whether the probability of selecting an ace from a deck of cards is 1/13. We selected 5 cards from the pack and found one was an ace. Hence, we conclude the probability of selecting an ace is 1/5 = 20%. We also calculated a 95% confidence interval as 0.2 1.96 ) * *+ (1 ? * *+) = 0.2 0.52 So the confidence interval is (-0.32, 0.72). This proves we were right because 0.2 is in our confidence interval. NOTES FOR LEARNING This project has major flaws: ? it is not investigating a realistic applied problem ? it is a textbook example from probability (not inference) Other flaws include: ? The conclusions states the probability is 0.2, when this is only an estimate. This suggests a complete lack of understanding of the key ideas within this unit (and arguably outside this unit!). ? The calculation of the confidence interval is incorrect. Revise the correct formula. Note that the hypothesised value for the probability ( 1 12) should be used in calculation of the standard error when a hypothesis test is performed, but not for a confidence interval. ? The last sentence is meaningless; a sample proportion should always be in a 95% confidence interval for a population proportion since the sample proportion is our best estimate of the population proportion. ? They use the word prove. ? There is no acknowledgement that a probability below 0 is not reasonable. MARKING ? Executive Summary or Abstract: 0 - none presented ? Introduction: 0 - Question not suitable for MAS183 project ? Data collection process: 1 - project description could be repeated by another student ? Visualisation: 0 - none presented ? Methods: 0 - this is not a suitable topic for inference ? Assumptions: 0 - none discussed ? Analysis: 0 - inappropriate analysis ? Conclusion: 0 - statistics does not prove, it just provides some evidence ? Appendix: 0 - none presented ? Communication: 0 - no structure to report Mark: 1/20
"JUST EXAMPLE FOR REFERENCE"
Example report two Who is more likely to get the Covid vaccination, men or women? Author: Ross Taplin Executive summary We found women are more likely to get the Covid vaccination than men, but the difference was small. We asked 30 men and 30 women outside the Murdoch University library whether they would get vaccinated when it was available (or had already had the vaccination). 15 men said yes and 20 women said yes. This suggests women are more likely to get a vaccination however the difference was not statistically significant. A 95% confidence interval for the proportion of women getting vaccinated is (0.498, 0.835) and for men it was (0.321, 0.679). Since these CIs overlap, we cannot be sure women are more likely to get vaccinated. Main Report We expected women to be more likely to get a vaccination because women care more about people. We randomly asked people as they entered or left the library. We only allowed people to give an answer of yes or no. People who would not answer this question were left alone as we cannot force people to answer our question. We calculated the proportion of people saying yes to our question and then the standard error as 3(? (1 ? ?))/?, where p is the proportion saying yes and n is the number of people we asked. The confidence intervals were calculated by adding or subtracting 1.96 times the standard error. We repeated these calculations for both men and women. The details of our calculation are summarised in the Table below. women men number getting vaccinated = 20 15 number people asked = 30 30 sample proportion (phat) = 66.7% 50.0% SE of phat = 8.6% 9.1% 95% CI (lower) 49.8% 32.1% 95% CI (upper) 83.5% 67.9% We started collecting our data from 10am on Wednesday morning during week 12 of semester. It took us longer to get answers from 30 men than 30 women. There seemed to be fewer men outside the library, or maybe they were less keen to answer our question. We should have kept better records of how many people we asked and whether they were male or female. We also realised we did not ask them if they identified as male or female, we just wrote that down by looking at them. Page 7 of 10 NOTES FOR LEARNING The project has several attractive properties: ? It compares men and women and while it is not a randomised experiment this is reasonable for this problem (we cannot randomly allocate people to be male or female!). ? It includes a short, executive summary with the key points. ? It is possible to follow what calculations were performed, with not only answers but some indication of how these were calculated. ? The last paragraph provides some limitations of the project (a discussion of what could be done better). ? It uses techniques (not currently) covered in MAS183. However, there are some flaws: ? It is unlikely this data constitutes a random sample. This is okay (random samples in this situation are too hard for a project, and some would say impossible with any realistic budget!). The problem is the project implies a random sample (see the second sentence of the Main Report). ? The project provides some statements (implied or stated explicitly) that might be offensive or at least are not substantiated. For example, that women care more about people (this may be true, but there is no evidence provided). ? A p-value can be calculated to summarise evidence for this hypothesis. ? There is no picture. While pictures are less useful for proportions (for example, a pie chart of how many men say yes or no is not very helpful) a graph showing the estimated proportion (with confidence intervals added) would very quickly show the reader what proportion of the women and men would get vaccinated and how accurately these two proportions are estimated. ? The project makes some vague statements that could be quantified. For example, the first sentence of the executive summary states a difference is "small". This difference is never really quantified anywhere in the project and it is not clear what "small" means. The language used in the project could be more statistical/scientific. ? The confidence intervals are an approximation. While they are still accurate (so this is a minor point), this is not a difficult adjustment to make. MARKING ? Executive Summary or Abstract: 2 - key and findings clear ? Introduction: 1 - Question in the title of the project (not ideal) ? Data collection process: 2 - project description could be repeated by another student, limitations given ? Visualisation: 0 - none presented ? Methods: 2 - appropriate confidence interval calculated ? Assumptions: 0 - none discussed ? Analysis: 2 - suitable analysis presented ? Conclusion: 0 - none presented ? Appendix: 0 - none presented ? Communication: 1 - simple report, readable Mark: 10/20
"JUST EXAMPLE"
Example report two Who is more likely to get the Covid vaccination, men or women? Author: Ross Taplin Executive summary We found women are more likely to get the Covid vaccination than men, but the difference was small. We asked 30 men and 30 women outside the Murdoch University library whether they would get vaccinated when it was available (or had already had the vaccination). 15 men said yes and 20 women said yes. This suggests women are more likely to get a vaccination however the difference was not statistically significant. A 95% confidence interval for the proportion of women getting vaccinated is (0.498, 0.835) and for men it was (0.321, 0.679). Since these CIs overlap, we cannot be sure women are more likely to get vaccinated. Main Report We expected women to be more likely to get a vaccination because women care more about people. We randomly asked people as they entered or left the library. We only allowed people to give an answer of yes or no. People who would not answer this question were left alone as we cannot force people to answer our question. We calculated the proportion of people saying yes to our question and then the standard error as 3(? (1 ? ?))/?, where p is the proportion saying yes and n is the number of people we asked. The confidence intervals were calculated by adding or subtracting 1.96 times the standard error. We repeated these calculations for both men and women. The details of our calculation are summarised in the Table below. women men number getting vaccinated = 20 15 number people asked = 30 30 sample proportion (phat) = 66.7% 50.0% SE of phat = 8.6% 9.1% 95% CI (lower) 49.8% 32.1% 95% CI (upper) 83.5% 67.9% We started collecting our data from 10am on Wednesday morning during week 12 of semester. It took us longer to get answers from 30 men than 30 women. There seemed to be fewer men outside the library, or maybe they were less keen to answer our question. We should have kept better records of how many people we asked and whether they were male or female. We also realised we did not ask them if they identified as male or female, we just wrote that down by looking at them. Page 7 of 10 NOTES FOR LEARNING The project has several attractive properties: ? It compares men and women and while it is not a randomised experiment this is reasonable for this problem (we cannot randomly allocate people to be male or female!). ? It includes a short, executive summary with the key points. ? It is possible to follow what calculations were performed, with not only answers but some indication of how these were calculated. ? The last paragraph provides some limitations of the project (a discussion of what could be done better). ? It uses techniques (not currently) covered in MAS183. However, there are some flaws: ? It is unlikely this data constitutes a random sample. This is okay (random samples in this situation are too hard for a project, and some would say impossible with any realistic budget!). The problem is the project implies a random sample (see the second sentence of the Main Report). ? The project provides some statements (implied or stated explicitly) that might be offensive or at least are not substantiated. For example, that women care more about people (this may be true, but there is no evidence provided). ? A p-value can be calculated to summarise evidence for this hypothesis. ? There is no picture. While pictures are less useful for proportions (for example, a pie chart of how many men say yes or no is not very helpful) a graph showing the estimated proportion (with confidence intervals added) would very quickly show the reader what proportion of the women and men would get vaccinated and how accurately these two proportions are estimated. ? The project makes some vague statements that could be quantified. For example, the first sentence of the executive summary states a difference is "small". This difference is never really quantified anywhere in the project and it is not clear what "small" means. The language used in the project could be more statistical/scientific. ? The confidence intervals are an approximation. While they are still accurate (so this is a minor point), this is not a difficult adjustment to make. MARKING ? Executive Summary or Abstract: 2 - key and findings clear ? Introduction: 1 - Question in the title of the project (not ideal) ? Data collection process: 2 - project description could be repeated by another student, limitations given ? Visualisation: 0 - none presented ? Methods: 2 - appropriate confidence interval calculated ? Assumptions: 0 - none discussed ? Analysis: 2 - suitable analysis presented ? Conclusion: 0 - none presented ? Appendix: 0 - none presented ? Communication: 1 - simple report, readable Mark: 10/20
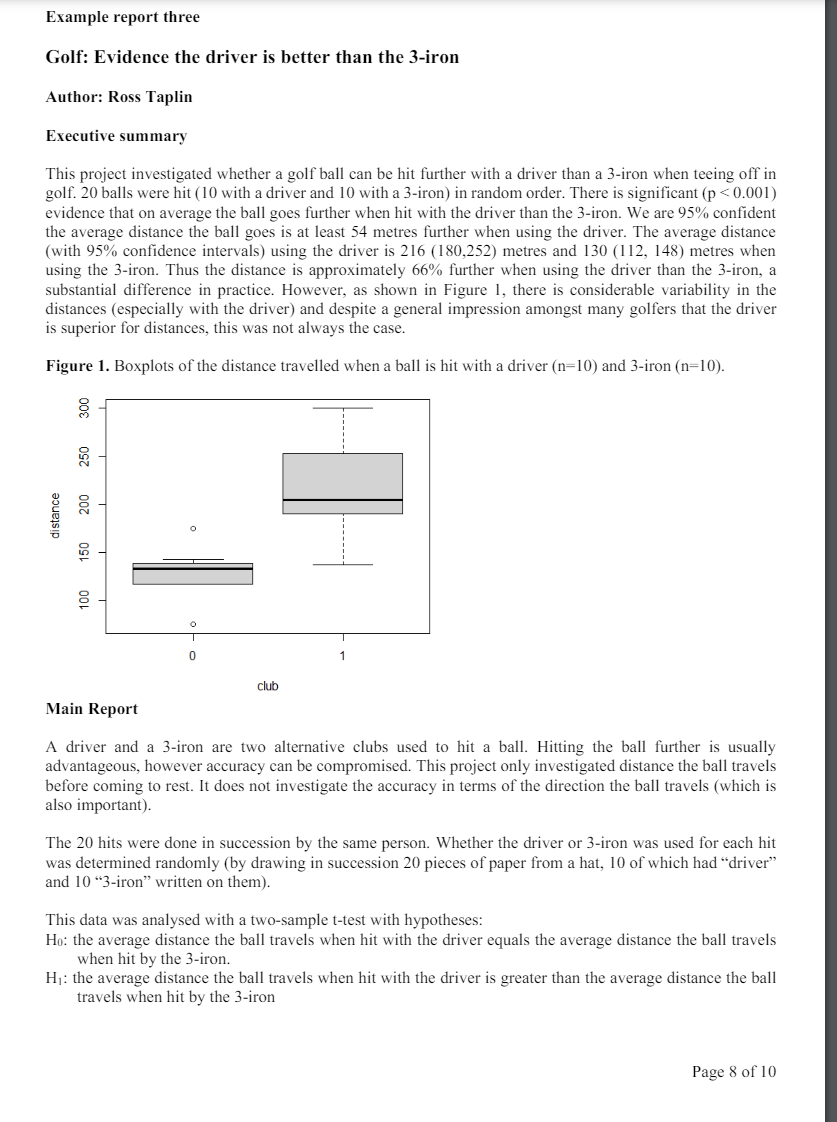
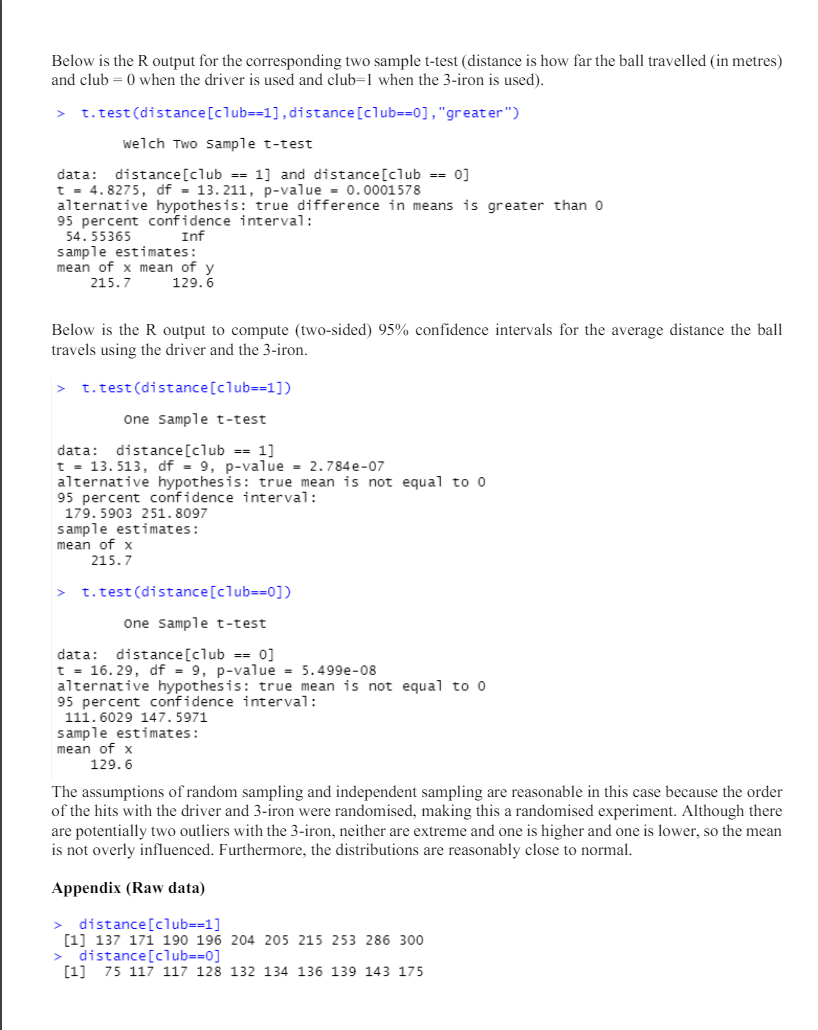
Example report three Golf: Evidence the driver is better than the 3-iron Author: Ross Taplin Executive summary This project investigated whether a golf ball can be hit further with a driver than a 3-iron when teeing off in golf. 20 balls were hit (10 with a driver and 10 with a 3-iron) in random order. There is significant (p t.test(distance[club==1],distance[club==0], "greater) welch Two Sample t-test data: distance[club == 1] and distance[club == 0] T = 4,8275, df = 13,211, p-value = 0.0001578 alternative hypothesis: true difference in means is greater than 0 95 percent confidence interval: 54.55365 Inf sample estimates: mean of x mean of y 215.7 129.6 Below is the R output to compute (two-sided) 95% confidence intervals for the average distance the ball travels using the driver and the 3-iron. > t.test(distance[club==1]) One Sample tT-tTest data: distance[club == 1] T = 13.513, df = 9, p-value = 2.784e-07 alternative hypothesis: true mean is not equal to 0 95 percent confidence interval: 179.5903 251. 8097 sample estimates: mean of x 215.7 > t.test(distance[club==0]) one Sample T-Test data: distance[club = 0] T =16.29, df = 9, p-value = 5.499e-08 alternative hypothesis: true mean is not equal to 0 95 percent confidence interval: 111.6029 147.5971 sample estimates: mean of x 129.6 The assumptions of random sampling and independent sampling are reasonable in this case because the order of the hits with the driver and 3-iron were randomised, making this a randomised experiment. Although there are potentially two outliers with the 3-iron, neither are extreme and one is higher and one is lower, so the mean is not overly influenced. Furthermore, the distributions are reasonably close to normal. Appendix (Raw data) > distance[club==1] [1] 137 171 190 196 204 205 215 253 286 300 > distance[club==0] [1] 75 117 117 128 132 134 136 139 143 175 NOTES FOR LEARNING This project addresses a practical problem and although most golfers know a driver is better than a 3-iron (in terms of average distance travelled), it is not obvious this would be the case for all golfers (some are hopeless with a driver!). In any case, knowing the answer is irrelevant to marking. The project has several attractive properties: It involves are carefully designed experiment, including randomisation of treatments (driver vs 3-iron). It includes a professional, short, executive summary with the key points (but obviously not all the detail). The technical analysis is excellent, from statement of hypotheses in simple English (not Greek symbols) through to calculations of p-values and confidence intervals. . Validity of the analysis (assumptions) were considered and assessed accurately. Some flaws: Figure I can be improved. For example, it does not state the distance is measured in metres and the horizontal axis (labelled "club" with values of 0 and I could be improved. Although it is clear from the main report what the values of 0 and 1 correspond to (if you can read R code!), this is not clear from the Executive Summary (where Figure 1 appears). Other influences on the distance travelled were ignored. For example, could the outliers (or any other observations) be influenced by wind gusts or a distraction such as noise? Keen observation when collecting the data is important (and often very useful), so even a mention that there was no noticeable differences between conditions under which each hit was taken would be an relevant addition. An obvious extra variable that might explain the distance the ball travels is time. The golfer might get better with cach hit (practice effect), although the raw data could simply be sorted from lowest to highest for our convenience. It is also possible the golfer might get worse (tiring effect). This could be investigated by plotting the data or even performing a regression with time as an explanatory variable (this could be done separately for the data with the driver and the data with the 3-iron). It can also be done using multiple regression (including both "club" and "time" as explanatory variables (but this is technically outside this unit). Note even just mention of this potential effect over time as a limitation would suffice. Presence of R code. This would be better in an appendix and words used to describe the results of the analysis. MARKING Executive Summary: 2 - overview of the project, key results from the analysis and a conclusion. . Introduction: 2 - clear research question Data collection process: 1 - Data collection included randomisation and could be repeated, limitations not given Visualisation: 1 - Suitable visualisation and associated comment but room for improvement. Methods: 1 - appropriate method, should justify with description of the variables Assumptions: 2 - Assumptions described correctly and checked. Analysis: 2 - Hypothesis test or confidence interval stated and carried out correctly with good notation. Conclusion: 0 - none presented Appendix: 1 - only has data Communication: 2 - Report is easy to follow and readable, no typos, good grammar Mark: 14/20
Step by Step Solution
There are 3 Steps involved in it

Get step-by-step solutions from verified subject matter experts