

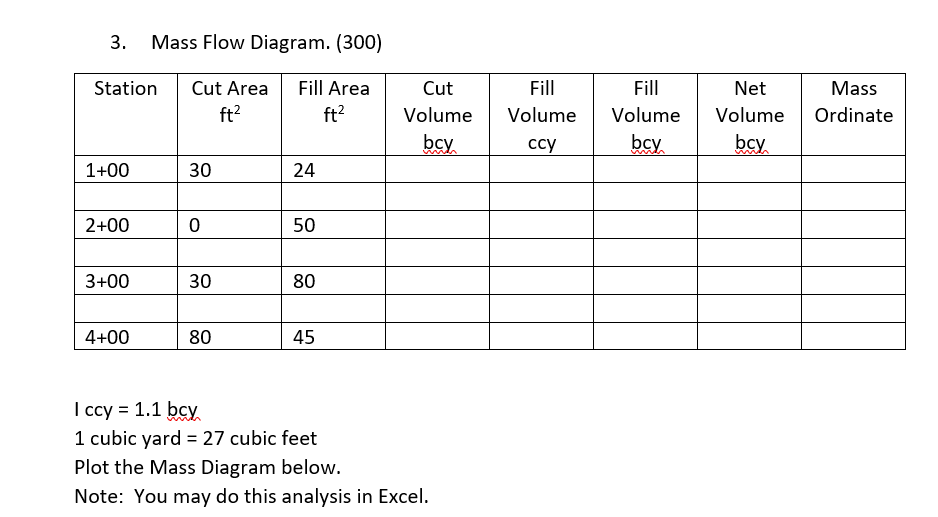
Question: Mass Flow Diagram. ( 3 0 0 ) table [ [ Station , table [ [ Cut Area ] , [ ft ^
Mass Flow Diagram.
tableStationtableCut AreafttableFill AreafttableCutVolumebcytableFillVolumeccytableFillVolumebcytableNetVolumebcytableMassOrdinate
I ccy
cubic yard cubic feet
Plot the Mass Diagram below.
Note: You may do this analysis in Excel.
Step by Step Solution
There are 3 Steps involved in it
1 Expert Approved Answer
Step: 1 Unlock

Question Has Been Solved by an Expert!
Get step-by-step solutions from verified subject matter experts
Step: 2 Unlock
Step: 3 Unlock