Master Budget
complete the master budget and provide brief analysis of the financial forecasted.
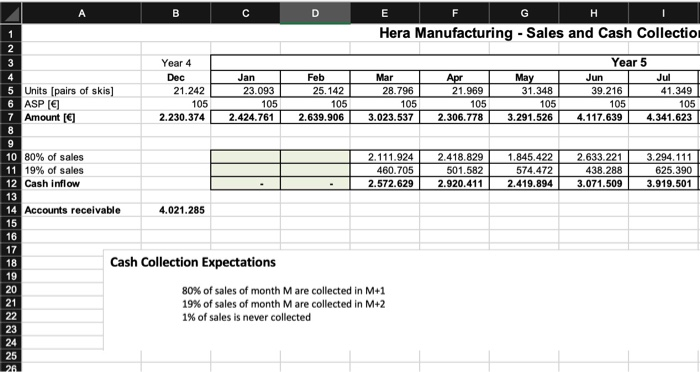
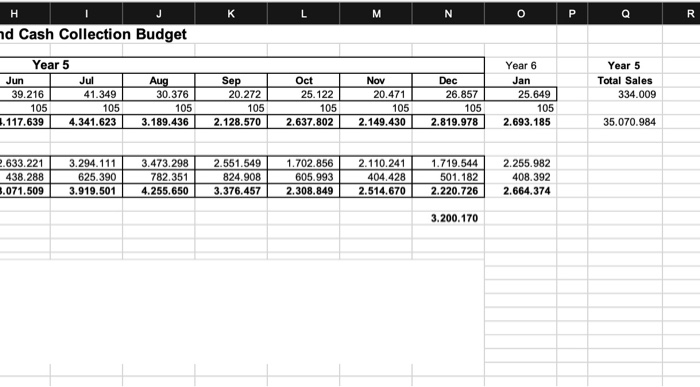
sales budget
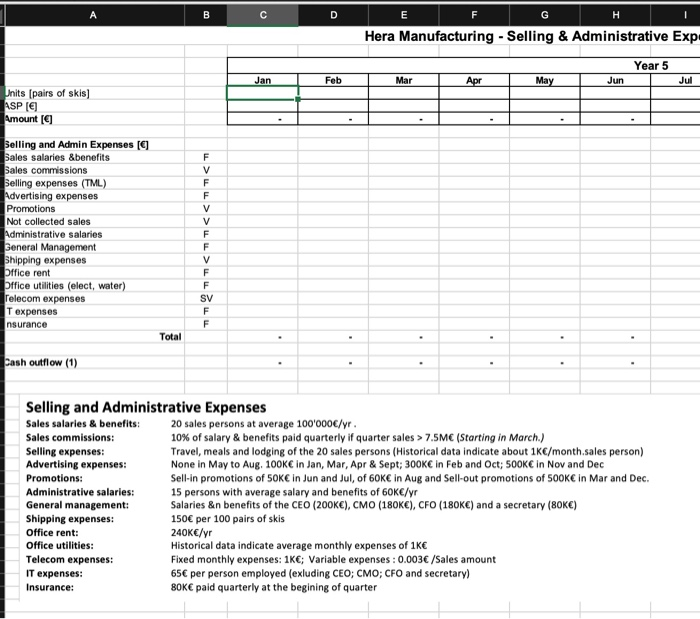
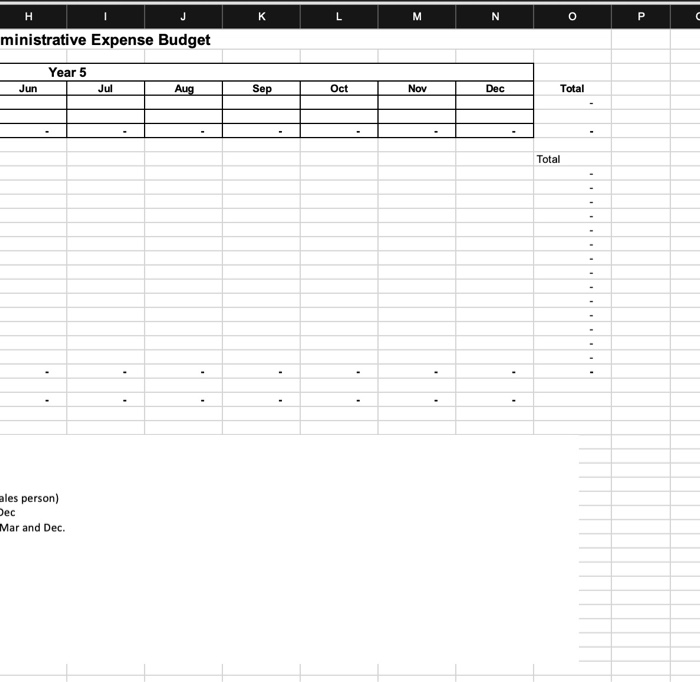
selling and admi expense budget
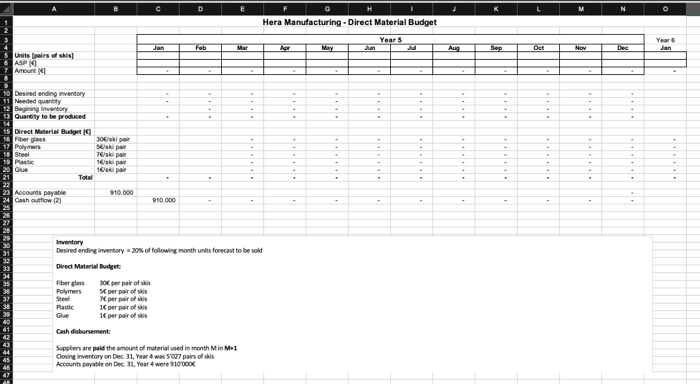
direct material budget
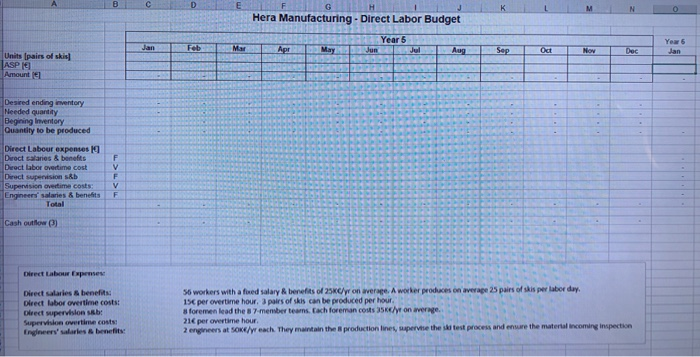
direct labor budget
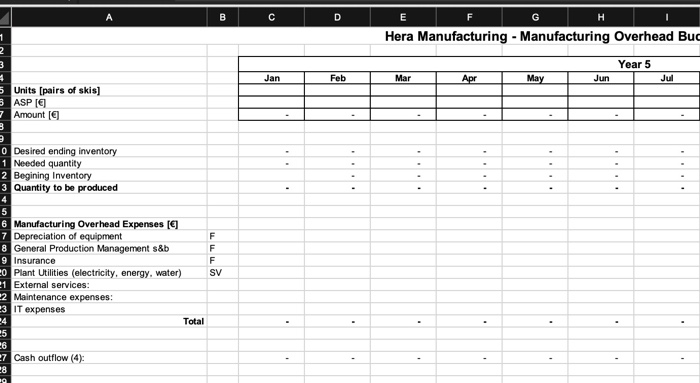
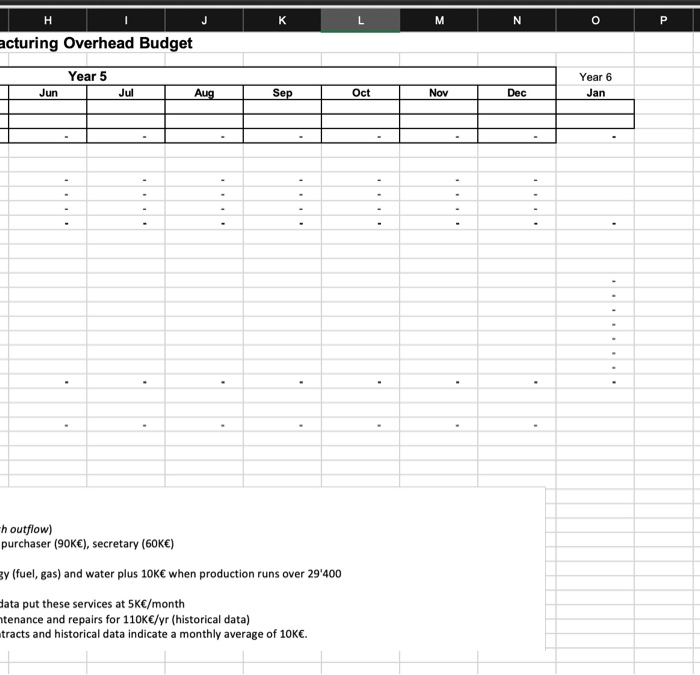
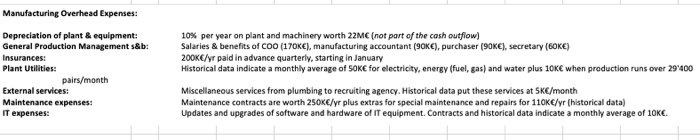
manufacturing overhead
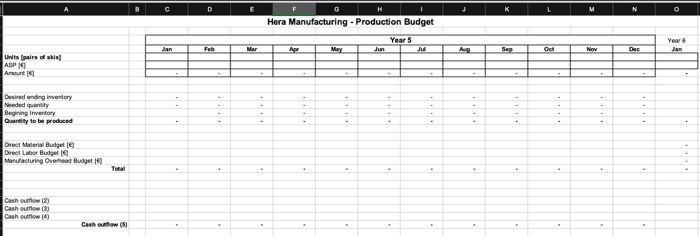
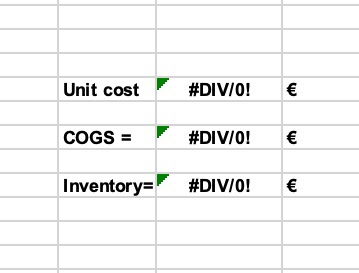
production budget
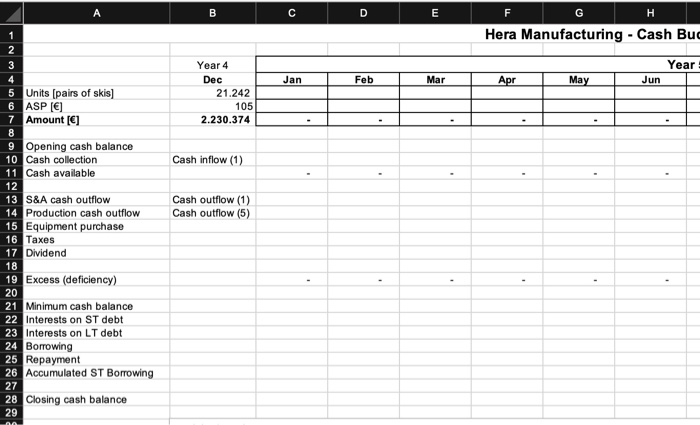
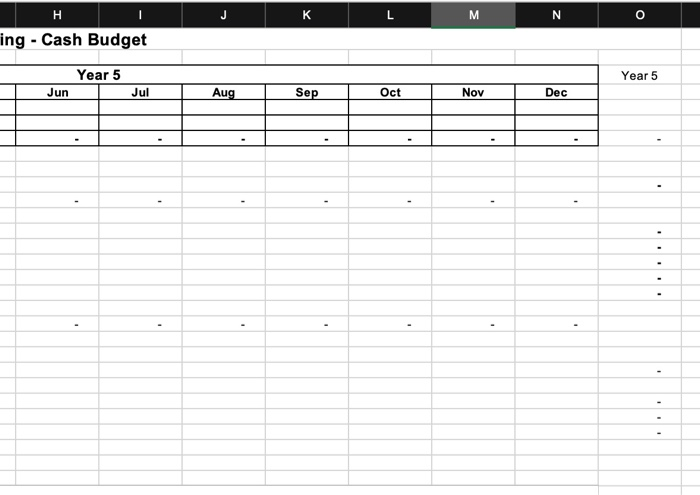
CASH Budget
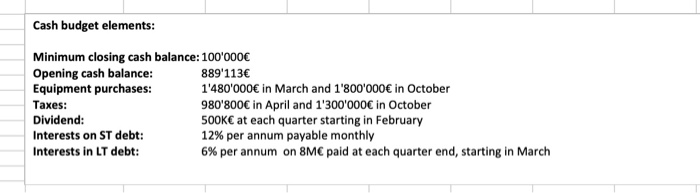
income statement
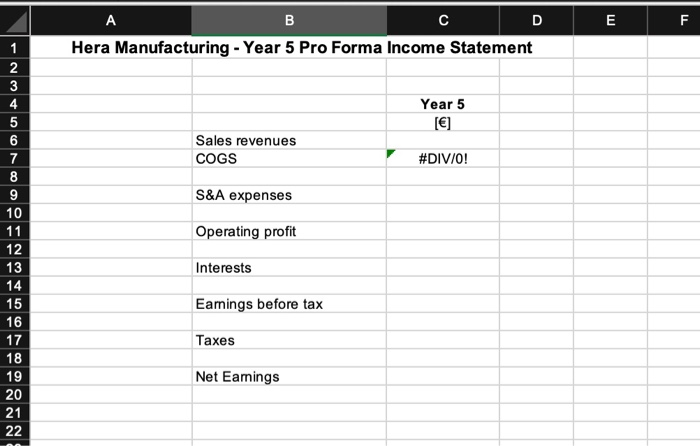
balance sheet
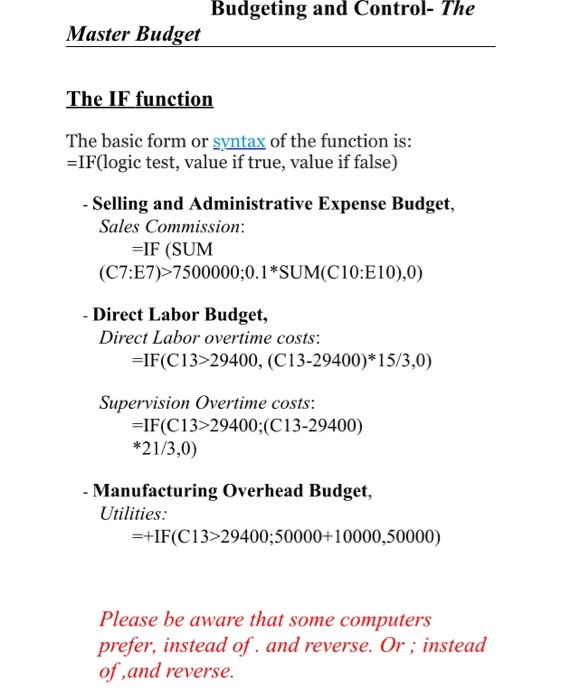
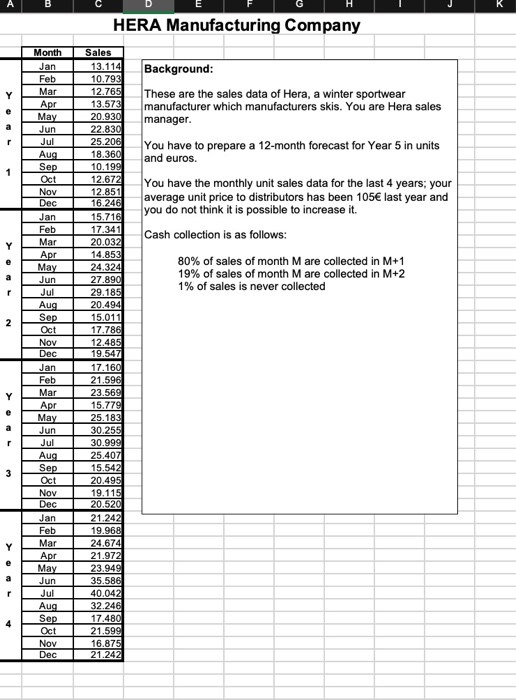
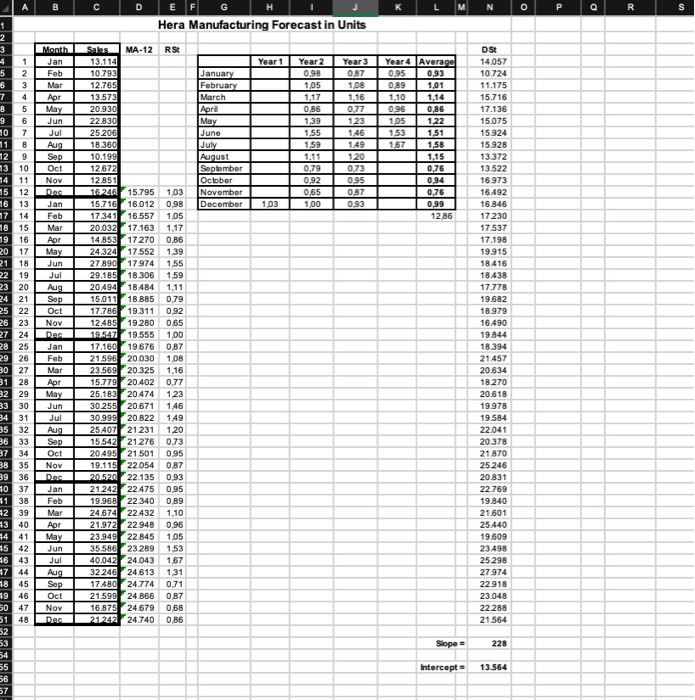
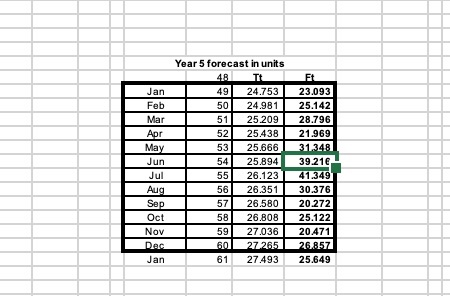
Budgeting and Control- The Master Budget The IF function The basic form or syntax of the function is: =IF(logic test, value if true, value if false) - Selling and Administrative Expense Budget, Sales Commission: =IF (SUM (C7:E7)>7500000;0.1*SUM(C10:E10),0) - Direct Labor Budget, Direct Labor overtime costs: =IF(C13>29400, (C13-29400)*15/3,0) Supervision Overtime costs: =IF(C13>29400;(C13-29400) *21/3,0) - Manufacturing Overhead Budget, Utilities: =+IF(C13>29400;50000+10000,50000) Please be aware that some computers prefer, instead of and reverse. Or, instead of and reverse. HERA Manufacturing Company Y e Month Jan Feb Mar Apr May Jun Jul Aug Sep Oct a r 1 Background: These are the sales data of Hera, a winter sportwear manufacturer which manufacturers skis. You are Hera sales manager. You have to prepare a 12-month forecast for Year 5 in units and euros. You have the monthly unit sales data for the last 4 years; your average unit price to distributors has been 105 last year and you do not think it is possible to increase it. Cash collection is as follows: 80% of sales of month M are collected in M+1 19% of sales of month M are collected in M+2 1% of sales is never collected Nov Y e r 2 Sales 13.114 10.793 12.765 13.573 20.930 22.830 25.206 18.360 10.199 12.672 12.851 16.246 15.716 17.341 20.032 14.853 24.324 27.890 29.185 20.494 15.011 17.786 12.485 19.547 17.160 21.596 23.569 15.779 25.183 30.255 30.999 25.407 15.542 20.495 19.115 20.520 21.242 19.968 24.674 21.972 23.949 35.586 40.042 32.246 17.480 21.599 16.875 21.242 Y Dec Jan Feb Mar Apr May Jun Jul Aug Sep Oct Nov Dec Jan Feb Mar Apr May Jun Jul Aug Sep Oct Nov Dec Jan Feb Mar Apr May Jun Jul Aug Sep Oct Nov Dec a r 3 Y e r 4 A B D E G N O P R S Hera Manufacturing Forecast in Units RS Year 1 Month Jan Fab Mar Apr May Jun Jul Aug Sep January February March April May June July August September October November December Year 2 0.98 1,05 1,17 0.86 1,39 1.55 1.59 1.11 0,79 0.92 0,65 1,00 Year 3 0.87 1.08 1.16 0.77 123 1.46 149 120 0.73 0.95 0.87 0.93 Year 4 Average 0.95 0,93 0.89 1,01 1.10 1,14 0.96 0,86 1.05 122 1.53 1,51 1.67 1,58 1.15 0,76 0.94 0,76 Oct Nov Dog Jan 103 0.99 Feb 12.86 1 2 3 4 1 5 2. 8 3 7 4 8 5 6 110 7 8 12 9 13 10 14 11 15 12 16 13 17 14 18 15 19 16 2017 R1 18 22 19 23 20 24 21 25 22 26 23 27 24 28 25 29 26 30 27 31 28 32 29 33 30 34 31 35 32 36 33 37 34 38 35 39 36 10 37 11 38 2 39 #3 40 74 41 85 42 46 43 47 44 48 45 49 46 50 47 31 48 Mar Aor May Jun Jul Aug Sep Oct Nov Dec Jan Feb Mar Salas MA-12 13.114 10.793 12.765 13.573 20.930 22830 25 206 18.360 10.199 12672 12.851 16246 15.795 15.716 16.012 17.341 16.557 20.03217.163 14.853 17270 24.324 17.552 27890 17974 29.185 18.306 20.494 18484 15.011 18.885 17.786 19311 12485 19280 19547 19.555 17.160 19.676 21.59 20.030 23.569 20.325 15.779 20402 25.183 20 474 30255 20.671 30.999 20.822 25.407 21231 15.542 21276 20495 21501 19.115 22.054 20.520 22.135 21.242 22475 19.968 22.340 24.674 22432 21.972 22.948 23.949 22 845 35.58623289 40.042 24.043 32 246 24 613 17.480 24.774 21.599 24 866 16.875 24.679 21.242 24.740 DS 14.057 10.724 11.175 15.716 17.136 15.075 15.924 15.928 13.372 13.522 16.973 16.492 16.846 17230 17537 17.198 19.915 18416 18.438 17.778 19.682 18.979 16.490 19.844 18.394 21457 20.634 18270 20.618 19.978 19.584 22.041 20.378 21870 25246 20.831 22.769 19.840 21.601 25440 19.609 23498 25298 27 974 22.918 23.048 22288 21.564 Aor May 1,03 0.98 1.05 1.17 0.86 1.39 155 1.59 1.11 0.79 0.92 0.65 1.00 0.87 1.08 1.16 0.77 1.23 1.46 1.49 120 0.73 0.95 087 0.93 0.95 0.89 1.10 0.96 1.05 153 1.67 131 0.71 0.87 068 0.86 Jun Aug Sep Oct Nov Jan Feb Mar Aor May Jun Jul Aug Sop Oct Nov Das Slope 228 53 54 55 56 57 Intercept 13.564 Jan Feb Mar Apr May Jun Jul Aug Sep Oct Nov Dec Jan Year 5 forecast in units Tt 49 24.753 50 24.981 51 25.209 52 25.438 53 25.666 54 25.894 55 26.123 56 26.351 57 26.580 58 26.808 59 27.036 60 27.265 61 27.493 23.093 25.142 28.796 21.969 31348 39.21 41.349 30.376 20.272 25.122 20 471 26.8.57 25.649 A B C D E F G H 1 Hera Manufacturing - Sales and Cash Collection 2 3 Year 4 Year 5 4 Dec Jan Feb Mar Apr May Jun Jul 5 Units (pairs of skis] 21.242 23.093 25.142 28.796 21.969 31.348 39.216 41.349 6 ASP () 105 105 105 105 105 105 105 105 7 Amount ( 2.230.374 2.424.761 2.639.906 3.023.537 2.306.778 3.291.526 4.117.639 4.341.623 8 9 10 80% of sales 2.111.924 2.418.829 1.845,422 2.633.221 3.294,111 11 19% of sales 460.705 501.582 574.472 438.288 625.390 12 Cash inflow 2.572.629 2.920.411 2.419.894 3.071.509 3.919.501 13 14 Accounts receivable 4.021.285 15 16 17 18 Cash Collection Expectations 19 20 80% of sales of month M are collected in M+1 21 19% of sales of month M are collected in M+2 22 1% of sales is never collected 23 24 25 26. H J L M N R nd Cash Collection Budget Year 5 Jun Jul 39.216 41.349 105 105 3.117.639 4.341.623 Aug 30.376 105 3.189.436 Sep 20.272 105 2.128.570 Oct 25.122 105 2.637.802 Year 5 Total Sales 334.009 Nov 20.471 105 2.149.430 Year 6 Jan 25.649 105 2.693.185 Dec 26.857 105 2.819.978 35.070.984 2.633.221 438.288 3.071.509 3.294.111 625.390 3.919.501 3.473.298 782.351 4.255.650 2.551.549 824.908 3.376.457 1.702.856 605.993 2.308.849 2.110.241 404.428 2.514.670 1.719.544 501.182 2.220.726 2.255.982 408.392 2.664.374 3.200.170 B D E F G H Hera Manufacturing - Selling & Administrative Exp Year 5 Jan Feb Mar Apr May Jun Jul Units (pairs of skis) ASP ( Amount [9 7.5M (Starting in March.) Selling expenses: Travel, meals and lodging of the 20 sales persons (Historical data indicate about 1KC/month.sales person) Advertising expenses: None in May to Aug. 100K in Jan, Mar, Apr & Sept; 300K in Feb and Oct; 500K in Nov and Dec Promotions: Sell-in promotions of SOK in Jun and Jul, of 60K in Aug and Sell-out promotions of 500K in Mar and Dec. Administrative salaries: 15 persons with average salary and benefits of 60K/yr General management: Salaries &n benefits of the CEO (200K), CMO (180K), CFO (180K) and a secretary (80K) Shipping expenses: 150 per 100 pairs of skis office rent: 240K/yr Office utilities: Historical data indicate average monthly expenses of 15 Telecom expenses: Fixed monthly expenses: 1Ke; variable expenses : 0.003 /Sales amount IT expenses: 65 per person employed (exluding CEO; CMO; CFO and secretary) Insurance: BOK paid quarterly at the begining of quarter H J L M N P C ministrative Expense Budget Year 5 Jun Jul Aug Sep Oct Nov Dec Total Total - ales person) Dec Mar and Dec. C D M N O Hera Manufacturing - Direct Material Budget Years Year Jan Jan Mar Apr May Sep Oct Dec Units pairs of skil ASP14 Amount ... .... .... . . 10 Desired ending inventory 11 Needed quantity 12 Begining inventory 13 Quantity to be produced 15 Direct Material Budget 19 17 Polymers Steel 306 si par Sipar 76 pair 16ski par 16 pair ...... ...... ...... Glue ........ Total Accounts payable Cash outflow (2) 910.000 10.000 Inventory Desired ending inventory -20% of following month units forecast to be sold Direct Material Budget Fiberglass Xper pair of skis Polymers Sper pair of his per pair of skis Plastic per pair of skis Glue per pair of skis Cash disbursement Suppliers are paid the amount of material used in month Min M-1 Closing inventory on Dec. 31, Year 4 was 5027 pairs of skis Accounts payable on Dec. 31. Year 4 were 910 000 ORA B O G Hera Manufacturing - Direct Labor Budget Jan Mar Apr Year 5 Jun Year 6 lan May Aug Sep Oct Nov Dec Units pairs of skis JASP 19 Amount Desired ending inventory Needed quantity Begining Inventory Quantity to be produced Direct Labour expenses 10 Direct salaries & benefits Direct labor overtime cost Direct supervision s&b Supervision overtime costs Engineers' salaries & benefits Total F V F V F Cash outflow ) Direct Labour Expenses Direct Salaries benefits Direct labor overtime costs: Direct supervision ab: Supervision overtime costs Engineers' salaries & benefits 56 workers with a foed salary & benefits of 25K/y on wege. A worker produces on average 25 pairs of skis per labor day. 15 per overtime hour. 3 pairs of skis can be produced per hour foremen lead the 87 member tearns. Each foreman costs 356 on average 21 per overtime hour 2 engineers at SoK/w each. They maintain the production lines, supervise the test process and ensure the material coming inspection A B D E F G H Hera Manufacturing - Manufacturing Overhead Buc 1 2 3 Year 5 Jan Feb Mar Apr May Jun Jul 5 Units (pairs of skis] 3 ASP [] 7 Amount (9) 3 0 Desired ending inventory 1 Needed quantity 2 Begining Inventory 3 Quantity to be produced 4 5 6 Manufacturing Overhead Expenses (6) 7 Depreciation of equipment F 8 General Production Management s&b F 9 Insurance F 20 Plant Utilities (electricity, energy, water) SV 21 External services: 2 Maintenance expenses: 23 IT expenses Total 25 26 27 Cash outflow (4): 28 10 H M N P acturing Overhead Budget Year 5 Year 6 Jan Jun Jul Aug Sep Oct Nov Dec -h outflow) purchaser (90K), secretary (60K) sy (fuel, gas) and water plus 10K when production runs over 29'400 data put these services at 5k/month tenance and repairs for 110K/yr (historical data) tracts and historical data indicate a monthly average of 10K. Manufacturing Overhead Expenses: Depreciation of plant & equipment: General Production Management s&b: Insurances: Plant Utilities: pairs/month External services: Maintenance expenses IT expenses: 10% per year on plant and machinery worth 22MC (not part of the cash outflow) Salaries & benefits of COO (170K), manufacturing accountant (90K), purchaser (90K), secretary (6OKE) 200KC/yr paid in advance quarterly, starting in January Historical data indicate a monthly average of Soke for electricity, energy (Fuel, gas) and water plus 10K when production runs over 29'400 Miscellaneous services from plumbing to recruiting agency. Historical data put these services at SKC/month Maintenance contracts are worth 250K/yr plus extras for special maintenance and repairs for 110K/yr (historical data) Updates and upgrades of software and hardware of IT equipment. Contracts and historical data indicate a monthly average of 10K. c D E Hera Manufacturing - Production Budget Year 5 Apr May Jun Ju Year Jan Jan Feb Mar A Sep Oct Nov Dec Units pairs of skil ASP 10 Amount Desired ending inventory Needed quantity Begining Inventory Quantity to be produced Direct Material Budget Direct Labor Budget Manufacturing Overhead Budget Total Cash outlow (2) Cash outflow (3) Cash outflow (4) Cashouw (51 Unit cost #DIV/0! COGS = #DIV/0! Inventory= #DIV/0! B D E F G H Hera Manufacturing - Cash Bu Year Jan Feb Mar Apr May Jun Year 4 Dec 21.242 105 2.230.374 Cash inflow (1) Cash outflow (1) Cash outflow (5) 1 2 3 4 5 Units (pairs of skis) 6 ASP () 7 Amount [] 8 9 Opening cash balance 10 Cash collection 11 Cash available 12 13 S&A cash outflow 14 Production cash outflow 15 Equipment purchase 16 Taxes 17 Dividend 18 19 Excess (deficiency) 20 21 Minimum cash balance 22 Interests on ST debt 23 Interests on LT debt 24 Borrowing 25 Repayment 26 Accumulated ST Borrowing 27 28 Closing cash balance 29 00 H J L M N O ing - Cash Budget Year 5 Year 5 Jun Jul Aug Sep Oct Nov Dec Cash budget elements: Minimum closing cash balance: 100'000 Opening cash balance: 889'1136 Equipment purchases: 1'480'000 in March and 1'800'000 in October Taxes: 980'800 in April and 1'300'000 in October Dividend: 500K at each quarter starting in February Interests on ST debt: 12% per annum payable monthly Interests in LT debt: 6% per annum on 8M paid at each quarter end, starting in March E F A B D Hera Manufacturing - Year 5 Pro Forma Income Statement Year 5 [] Sales revenues COGS #DIV/0! 1 2 3 4 5 6 7 8 9 10 11 12 13 14 15 16 17 S&A expenses Operating profit Interests Eamings before tax Taxes 18 Net Earings 19 20 21 22 E G H B D F Hera Manufacturing - Year 5 Pro Forma Balance Sheet Balance sheet as of Dec. 31 of Year 5 Assets Liabilities Accounts payable Cash Accounts receivable Inventory Current assets Current liabilities 22.000.000 Plant & machinery 22.000.000 Plant & machinery Depreciation Land 22.000.000 Long term debt Equity Net eamings Dividend 1 2 3 4 5 6 7 8 9 10 11 12 13 14 15 16 17 18 19 20 21 22 23 24 25 26 27 28 29 30 Total assets 22.000.000 22.000.000 Plant & machinery as of Dec. 31 of Year 4: 22'000'000 Land value: 2'000'000 Equity as of Dec. 31 of Year 4: 17'143'079 Budgeting and Control- The Master Budget The IF function The basic form or syntax of the function is: =IF(logic test, value if true, value if false) - Selling and Administrative Expense Budget, Sales Commission: =IF (SUM (C7:E7)>7500000;0.1*SUM(C10:E10),0) - Direct Labor Budget, Direct Labor overtime costs: =IF(C13>29400, (C13-29400)*15/3,0) Supervision Overtime costs: =IF(C13>29400;(C13-29400) *21/3,0) - Manufacturing Overhead Budget, Utilities: =+IF(C13>29400;50000+10000,50000) Please be aware that some computers prefer, instead of and reverse. Or, instead of and reverse. HERA Manufacturing Company Y e Month Jan Feb Mar Apr May Jun Jul Aug Sep Oct a r 1 Background: These are the sales data of Hera, a winter sportwear manufacturer which manufacturers skis. You are Hera sales manager. You have to prepare a 12-month forecast for Year 5 in units and euros. You have the monthly unit sales data for the last 4 years; your average unit price to distributors has been 105 last year and you do not think it is possible to increase it. Cash collection is as follows: 80% of sales of month M are collected in M+1 19% of sales of month M are collected in M+2 1% of sales is never collected Nov Y e r 2 Sales 13.114 10.793 12.765 13.573 20.930 22.830 25.206 18.360 10.199 12.672 12.851 16.246 15.716 17.341 20.032 14.853 24.324 27.890 29.185 20.494 15.011 17.786 12.485 19.547 17.160 21.596 23.569 15.779 25.183 30.255 30.999 25.407 15.542 20.495 19.115 20.520 21.242 19.968 24.674 21.972 23.949 35.586 40.042 32.246 17.480 21.599 16.875 21.242 Y Dec Jan Feb Mar Apr May Jun Jul Aug Sep Oct Nov Dec Jan Feb Mar Apr May Jun Jul Aug Sep Oct Nov Dec Jan Feb Mar Apr May Jun Jul Aug Sep Oct Nov Dec a r 3 Y e r 4 A B D E G N O P R S Hera Manufacturing Forecast in Units RS Year 1 Month Jan Fab Mar Apr May Jun Jul Aug Sep January February March April May June July August September October November December Year 2 0.98 1,05 1,17 0.86 1,39 1.55 1.59 1.11 0,79 0.92 0,65 1,00 Year 3 0.87 1.08 1.16 0.77 123 1.46 149 120 0.73 0.95 0.87 0.93 Year 4 Average 0.95 0,93 0.89 1,01 1.10 1,14 0.96 0,86 1.05 122 1.53 1,51 1.67 1,58 1.15 0,76 0.94 0,76 Oct Nov Dog Jan 103 0.99 Feb 12.86 1 2 3 4 1 5 2. 8 3 7 4 8 5 6 110 7 8 12 9 13 10 14 11 15 12 16 13 17 14 18 15 19 16 2017 R1 18 22 19 23 20 24 21 25 22 26 23 27 24 28 25 29 26 30 27 31 28 32 29 33 30 34 31 35 32 36 33 37 34 38 35 39 36 10 37 11 38 2 39 #3 40 74 41 85 42 46 43 47 44 48 45 49 46 50 47 31 48 Mar Aor May Jun Jul Aug Sep Oct Nov Dec Jan Feb Mar Salas MA-12 13.114 10.793 12.765 13.573 20.930 22830 25 206 18.360 10.199 12672 12.851 16246 15.795 15.716 16.012 17.341 16.557 20.03217.163 14.853 17270 24.324 17.552 27890 17974 29.185 18.306 20.494 18484 15.011 18.885 17.786 19311 12485 19280 19547 19.555 17.160 19.676 21.59 20.030 23.569 20.325 15.779 20402 25.183 20 474 30255 20.671 30.999 20.822 25.407 21231 15.542 21276 20495 21501 19.115 22.054 20.520 22.135 21.242 22475 19.968 22.340 24.674 22432 21.972 22.948 23.949 22 845 35.58623289 40.042 24.043 32 246 24 613 17.480 24.774 21.599 24 866 16.875 24.679 21.242 24.740 DS 14.057 10.724 11.175 15.716 17.136 15.075 15.924 15.928 13.372 13.522 16.973 16.492 16.846 17230 17537 17.198 19.915 18416 18.438 17.778 19.682 18.979 16.490 19.844 18.394 21457 20.634 18270 20.618 19.978 19.584 22.041 20.378 21870 25246 20.831 22.769 19.840 21.601 25440 19.609 23498 25298 27 974 22.918 23.048 22288 21.564 Aor May 1,03 0.98 1.05 1.17 0.86 1.39 155 1.59 1.11 0.79 0.92 0.65 1.00 0.87 1.08 1.16 0.77 1.23 1.46 1.49 120 0.73 0.95 087 0.93 0.95 0.89 1.10 0.96 1.05 153 1.67 131 0.71 0.87 068 0.86 Jun Aug Sep Oct Nov Jan Feb Mar Aor May Jun Jul Aug Sop Oct Nov Das Slope 228 53 54 55 56 57 Intercept 13.564 Jan Feb Mar Apr May Jun Jul Aug Sep Oct Nov Dec Jan Year 5 forecast in units Tt 49 24.753 50 24.981 51 25.209 52 25.438 53 25.666 54 25.894 55 26.123 56 26.351 57 26.580 58 26.808 59 27.036 60 27.265 61 27.493 23.093 25.142 28.796 21.969 31348 39.21 41.349 30.376 20.272 25.122 20 471 26.8.57 25.649 A B C D E F G H 1 Hera Manufacturing - Sales and Cash Collection 2 3 Year 4 Year 5 4 Dec Jan Feb Mar Apr May Jun Jul 5 Units (pairs of skis] 21.242 23.093 25.142 28.796 21.969 31.348 39.216 41.349 6 ASP () 105 105 105 105 105 105 105 105 7 Amount ( 2.230.374 2.424.761 2.639.906 3.023.537 2.306.778 3.291.526 4.117.639 4.341.623 8 9 10 80% of sales 2.111.924 2.418.829 1.845,422 2.633.221 3.294,111 11 19% of sales 460.705 501.582 574.472 438.288 625.390 12 Cash inflow 2.572.629 2.920.411 2.419.894 3.071.509 3.919.501 13 14 Accounts receivable 4.021.285 15 16 17 18 Cash Collection Expectations 19 20 80% of sales of month M are collected in M+1 21 19% of sales of month M are collected in M+2 22 1% of sales is never collected 23 24 25 26. H J L M N R nd Cash Collection Budget Year 5 Jun Jul 39.216 41.349 105 105 3.117.639 4.341.623 Aug 30.376 105 3.189.436 Sep 20.272 105 2.128.570 Oct 25.122 105 2.637.802 Year 5 Total Sales 334.009 Nov 20.471 105 2.149.430 Year 6 Jan 25.649 105 2.693.185 Dec 26.857 105 2.819.978 35.070.984 2.633.221 438.288 3.071.509 3.294.111 625.390 3.919.501 3.473.298 782.351 4.255.650 2.551.549 824.908 3.376.457 1.702.856 605.993 2.308.849 2.110.241 404.428 2.514.670 1.719.544 501.182 2.220.726 2.255.982 408.392 2.664.374 3.200.170 B D E F G H Hera Manufacturing - Selling & Administrative Exp Year 5 Jan Feb Mar Apr May Jun Jul Units (pairs of skis) ASP ( Amount [9 7.5M (Starting in March.) Selling expenses: Travel, meals and lodging of the 20 sales persons (Historical data indicate about 1KC/month.sales person) Advertising expenses: None in May to Aug. 100K in Jan, Mar, Apr & Sept; 300K in Feb and Oct; 500K in Nov and Dec Promotions: Sell-in promotions of SOK in Jun and Jul, of 60K in Aug and Sell-out promotions of 500K in Mar and Dec. Administrative salaries: 15 persons with average salary and benefits of 60K/yr General management: Salaries &n benefits of the CEO (200K), CMO (180K), CFO (180K) and a secretary (80K) Shipping expenses: 150 per 100 pairs of skis office rent: 240K/yr Office utilities: Historical data indicate average monthly expenses of 15 Telecom expenses: Fixed monthly expenses: 1Ke; variable expenses : 0.003 /Sales amount IT expenses: 65 per person employed (exluding CEO; CMO; CFO and secretary) Insurance: BOK paid quarterly at the begining of quarter H J L M N P C ministrative Expense Budget Year 5 Jun Jul Aug Sep Oct Nov Dec Total Total - ales person) Dec Mar and Dec. C D M N O Hera Manufacturing - Direct Material Budget Years Year Jan Jan Mar Apr May Sep Oct Dec Units pairs of skil ASP14 Amount ... .... .... . . 10 Desired ending inventory 11 Needed quantity 12 Begining inventory 13 Quantity to be produced 15 Direct Material Budget 19 17 Polymers Steel 306 si par Sipar 76 pair 16ski par 16 pair ...... ...... ...... Glue ........ Total Accounts payable Cash outflow (2) 910.000 10.000 Inventory Desired ending inventory -20% of following month units forecast to be sold Direct Material Budget Fiberglass Xper pair of skis Polymers Sper pair of his per pair of skis Plastic per pair of skis Glue per pair of skis Cash disbursement Suppliers are paid the amount of material used in month Min M-1 Closing inventory on Dec. 31, Year 4 was 5027 pairs of skis Accounts payable on Dec. 31. Year 4 were 910 000 ORA B O G Hera Manufacturing - Direct Labor Budget Jan Mar Apr Year 5 Jun Year 6 lan May Aug Sep Oct Nov Dec Units pairs of skis JASP 19 Amount Desired ending inventory Needed quantity Begining Inventory Quantity to be produced Direct Labour expenses 10 Direct salaries & benefits Direct labor overtime cost Direct supervision s&b Supervision overtime costs Engineers' salaries & benefits Total F V F V F Cash outflow ) Direct Labour Expenses Direct Salaries benefits Direct labor overtime costs: Direct supervision ab: Supervision overtime costs Engineers' salaries & benefits 56 workers with a foed salary & benefits of 25K/y on wege. A worker produces on average 25 pairs of skis per labor day. 15 per overtime hour. 3 pairs of skis can be produced per hour foremen lead the 87 member tearns. Each foreman costs 356 on average 21 per overtime hour 2 engineers at SoK/w each. They maintain the production lines, supervise the test process and ensure the material coming inspection A B D E F G H Hera Manufacturing - Manufacturing Overhead Buc 1 2 3 Year 5 Jan Feb Mar Apr May Jun Jul 5 Units (pairs of skis] 3 ASP [] 7 Amount (9) 3 0 Desired ending inventory 1 Needed quantity 2 Begining Inventory 3 Quantity to be produced 4 5 6 Manufacturing Overhead Expenses (6) 7 Depreciation of equipment F 8 General Production Management s&b F 9 Insurance F 20 Plant Utilities (electricity, energy, water) SV 21 External services: 2 Maintenance expenses: 23 IT expenses Total 25 26 27 Cash outflow (4): 28 10 H M N P acturing Overhead Budget Year 5 Year 6 Jan Jun Jul Aug Sep Oct Nov Dec -h outflow) purchaser (90K), secretary (60K) sy (fuel, gas) and water plus 10K when production runs over 29'400 data put these services at 5k/month tenance and repairs for 110K/yr (historical data) tracts and historical data indicate a monthly average of 10K. Manufacturing Overhead Expenses: Depreciation of plant & equipment: General Production Management s&b: Insurances: Plant Utilities: pairs/month External services: Maintenance expenses IT expenses: 10% per year on plant and machinery worth 22MC (not part of the cash outflow) Salaries & benefits of COO (170K), manufacturing accountant (90K), purchaser (90K), secretary (6OKE) 200KC/yr paid in advance quarterly, starting in January Historical data indicate a monthly average of Soke for electricity, energy (Fuel, gas) and water plus 10K when production runs over 29'400 Miscellaneous services from plumbing to recruiting agency. Historical data put these services at SKC/month Maintenance contracts are worth 250K/yr plus extras for special maintenance and repairs for 110K/yr (historical data) Updates and upgrades of software and hardware of IT equipment. Contracts and historical data indicate a monthly average of 10K. c D E Hera Manufacturing - Production Budget Year 5 Apr May Jun Ju Year Jan Jan Feb Mar A Sep Oct Nov Dec Units pairs of skil ASP 10 Amount Desired ending inventory Needed quantity Begining Inventory Quantity to be produced Direct Material Budget Direct Labor Budget Manufacturing Overhead Budget Total Cash outlow (2) Cash outflow (3) Cash outflow (4) Cashouw (51 Unit cost #DIV/0! COGS = #DIV/0! Inventory= #DIV/0! B D E F G H Hera Manufacturing - Cash Bu Year Jan Feb Mar Apr May Jun Year 4 Dec 21.242 105 2.230.374 Cash inflow (1) Cash outflow (1) Cash outflow (5) 1 2 3 4 5 Units (pairs of skis) 6 ASP () 7 Amount [] 8 9 Opening cash balance 10 Cash collection 11 Cash available 12 13 S&A cash outflow 14 Production cash outflow 15 Equipment purchase 16 Taxes 17 Dividend 18 19 Excess (deficiency) 20 21 Minimum cash balance 22 Interests on ST debt 23 Interests on LT debt 24 Borrowing 25 Repayment 26 Accumulated ST Borrowing 27 28 Closing cash balance 29 00 H J L M N O ing - Cash Budget Year 5 Year 5 Jun Jul Aug Sep Oct Nov Dec Cash budget elements: Minimum closing cash balance: 100'000 Opening cash balance: 889'1136 Equipment purchases: 1'480'000 in March and 1'800'000 in October Taxes: 980'800 in April and 1'300'000 in October Dividend: 500K at each quarter starting in February Interests on ST debt: 12% per annum payable monthly Interests in LT debt: 6% per annum on 8M paid at each quarter end, starting in March E F A B D Hera Manufacturing - Year 5 Pro Forma Income Statement Year 5 [] Sales revenues COGS #DIV/0! 1 2 3 4 5 6 7 8 9 10 11 12 13 14 15 16 17 S&A expenses Operating profit Interests Eamings before tax Taxes 18 Net Earings 19 20 21 22 E G H B D F Hera Manufacturing - Year 5 Pro Forma Balance Sheet Balance sheet as of Dec. 31 of Year 5 Assets Liabilities Accounts payable Cash Accounts receivable Inventory Current assets Current liabilities 22.000.000 Plant & machinery 22.000.000 Plant & machinery Depreciation Land 22.000.000 Long term debt Equity Net eamings Dividend 1 2 3 4 5 6 7 8 9 10 11 12 13 14 15 16 17 18 19 20 21 22 23 24 25 26 27 28 29 30 Total assets 22.000.000 22.000.000 Plant & machinery as of Dec. 31 of Year 4: 22'000'000 Land value: 2'000'000 Equity as of Dec. 31 of Year 4: 17'143'079