

Question: Mastery Problem: CVP Analysis Constructing a Cost-Volume-Profit Chart CVP Analysis and the Contribution Margin Income Statement For planning and control purposes, managers have a powerful
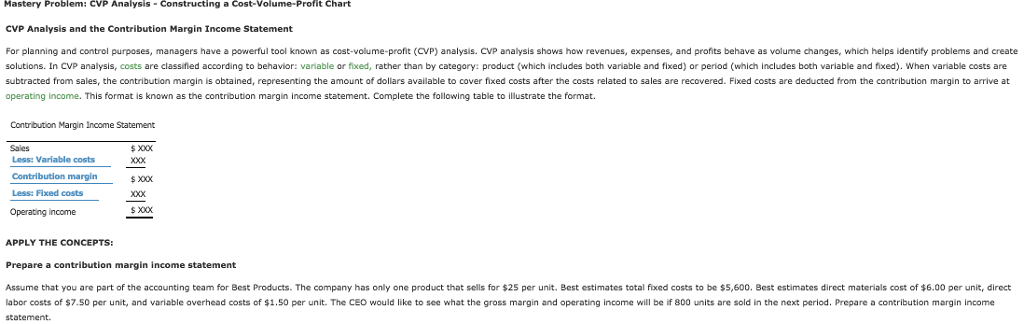
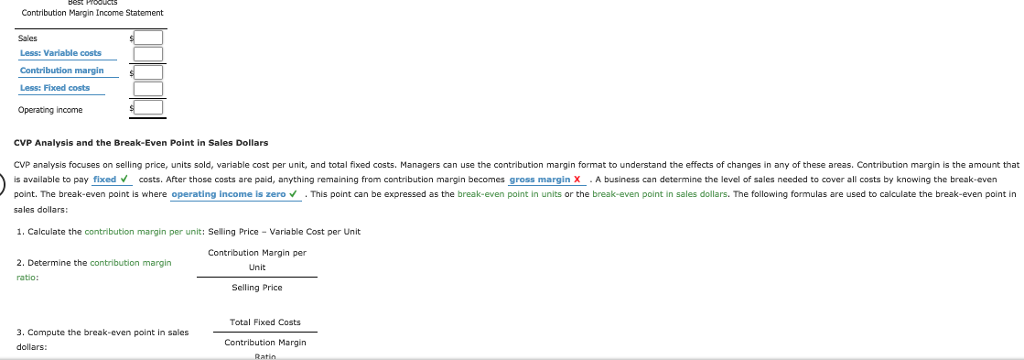
Mastery Problem: CVP Analysis Constructing a Cost-Volume-Profit Chart CVP Analysis and the Contribution Margin Income Statement For planning and control purposes, managers have a powerful tool known as cost-volume-profit (CVP) analysis. CVP analysis shows how revenues, expenses, and profits behave as volume changes, which helps identify problems and create solutions. In CVP analysis, costs are classifiled according to behavior: variable or fixed, rather than by category: product (which includes both variable and fixed) or period (which includes both variable and fixed). When variable costs are subtracted from sales, the contribution margin is obtained, representing the amount of dollars available to cover fixed costs after the costs related to sales are recovered. Fixed costs are deducted from the contribution margin to arrive at operating income. This format is known as the contribution margin income statement. Complete the following table to illustrate the format. Contrbution Margin Income Statement Sales Less: Variable costs Contribution margin Less: Fixed costs Operating ncome xoXx 2002 s X0XX APPLY THE CONCEPTS: Prepare a contribution margin income statement Assume that you are part of the accounting team for Best Products. The company has only one product that sells for $25 per unit. Best estimates total fixed costs to be $5,600. Best estimates direct materials cost of 6.00 per unit, direct labor costs of S7.50 per unit, and variable overhead costs of 1.50 per unit. The CEO would like to see what the gross margin and operating incomc will be if 800 units are sold in the next period. Prepare a contribution margin income
Step by Step Solution
There are 3 Steps involved in it

Get step-by-step solutions from verified subject matter experts