

Question: Mastery Problem: Financial Statement Analysis Question Content Area Liquidity and Solvency Measures Your friend, another accountant, has bet you that with your knowledge of accounting
Mastery Problem: Financial Statement Analysis
Question Content Area
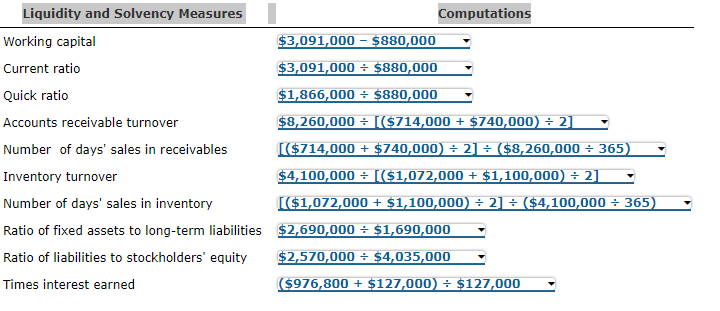
Liquidity and Solvency Measures
Your friend, another accountant, has bet you that with your knowledge of accounting and just the computations for common analytical measures, you can figure out many aspects of a company's financial statements. You take the bet!
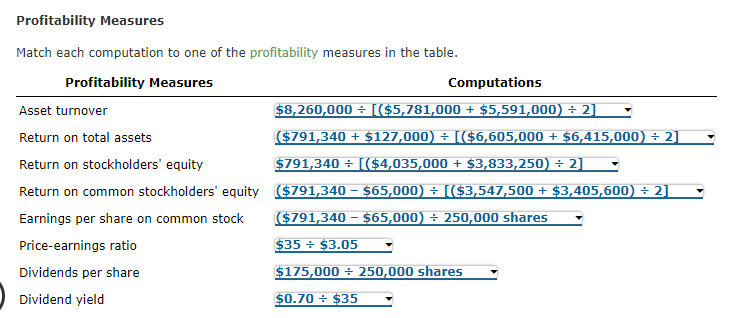
Match each computation to one of the liquidity and solvency measures in the table. (Hint: Begin by looking for simple computations and identifying the amounts in those computations. Look for other measures that use those amounts.)
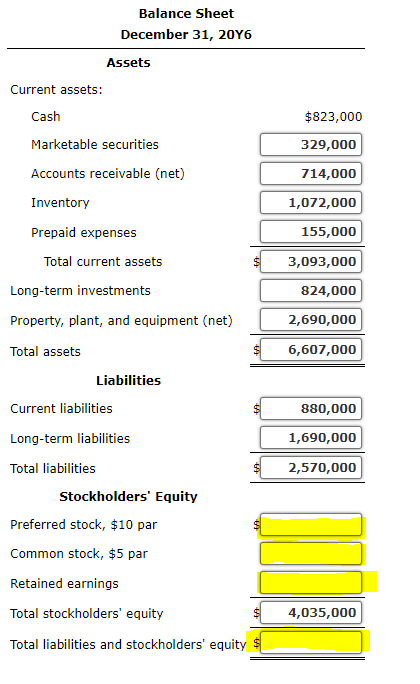
Balance Sheet
Use the following balance sheet form to enter amounts you identify from the computations on the Liquidity and Solvency Measures part. You will identify other amounts for the balance sheet on the Profitability Measures part. If you have a choice of two amounts, assume the first amount in the ratio is for the end of the year. Compute any missing amounts.
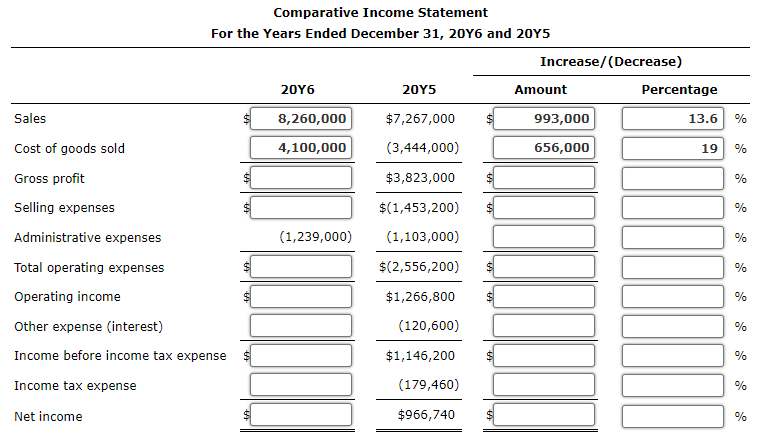
Comparative Income Statement
Use the following comparative income statement form to enter amounts you identify from the computations on the Liquidity and Solvency Measures part and on the Profitability Measures part. Compute any missing amounts and complete the horizontal analysis columns. Enter percentages as decimal amounts, rounded to one decimal place. When rounding, look only at the figure to the right of one decimal place. If
Liquidity and Solvency Measures Working capital Current ratio Quick ratio Accounts receivable turnover Number of days' sales in receivables Inventory turnover Number of days' sales in inventory Ratio of fixed assets to long-term liabilities Ratio of liabilities to stockholders' equity Times interest earned Computations $3,091,000 - $880,000 $3,091,000+ $880,000 $1,866,000+ $880,000 $8,260,000+ [($714,000 + $740,000) + 2] [($714,000+ $740,000) 2] ($8,260,000 365) $4,100,000 = [($1,072,000 + $1,100,000) 2] [($1,072,000+ $1,100,000) 2] ($4,100,000 365) $2,690,000 $1,690,000 $2,570,000+ $4,035,000 ($976,800 + $127,000) $127,000 Balance Sheet December 31, 20Y6 Assets Current assets: Cash Marketable securities Accounts receivable (net) Inventory Prepaid expenses Total current assets Long-term investments Property, plant, and equipment (net) Total assets Liabilities Current liabilities Long-term liabilities Total liabilities Preferred stock, $10 par Common stock, $5 par Retained earnings Total stockholders' equity Total liabilities and stockholders' equity $ Stockholders' Equity $823,000 329,000 714,000 1,072,000 155,000 $ 3,093,000 824,000 2,690,000 6,607,000 880,000 1,690,000 2,570,000 4,035,000 Profitability Measures Match each computation to one of the profitability measures in the table. Profitability Measures Asset turnover Return on total assets Return on stockholders' equity Return on common stockholders' equity Earnings per share on common stock Price-earnings ratio Dividends per share Dividend yield Computations $8,260,000 [($5,781,000 + $5,591,000) 2] ($791,340 + $127,000) [($6,605,000 + $6,415,000) 2] $791,340 [($4,035,000 + $3,833,250) 2] ($791,340 - $65,000) [($3,547,500 + $3,405,600) 2] ($791,340 - $65,000) 250,000 shares $35 + $3.05 $175,000 + 250,000 shares $0.70 + $35 Comparative Income Statement For the Years Ended December 31, 20Y6 and 20Y5 20Y6 20Y5 Amount 8,260,000 $7,267,000 4,100,000 (3,444,000) $3,823,000 $(1,453,200) (1,239,000) (1,103,000) $(2,556,200) $1,266,800 (120,600) $1,146,200 (179,460) $966,740 Sales Cost of goods sold Gross profit Selling expenses Administrative expenses Total operating expenses Operating income Other expense (interest) Income before income tax expense Income tax expense Net income Increase/(Decrease) 993,000 656,000 1000 Percentage 13.6 19 000 % % % % % % % % % % %
Step by Step Solution
There are 3 Steps involved in it

Get step-by-step solutions from verified subject matter experts