

Question: MAT 120 - Unit 3 M&Ms or Skittles Project (4) (1) (Protected View) - Word (Unlicensed Product) caroline.gad@yahoo.com X File Home Insert Design Layout References
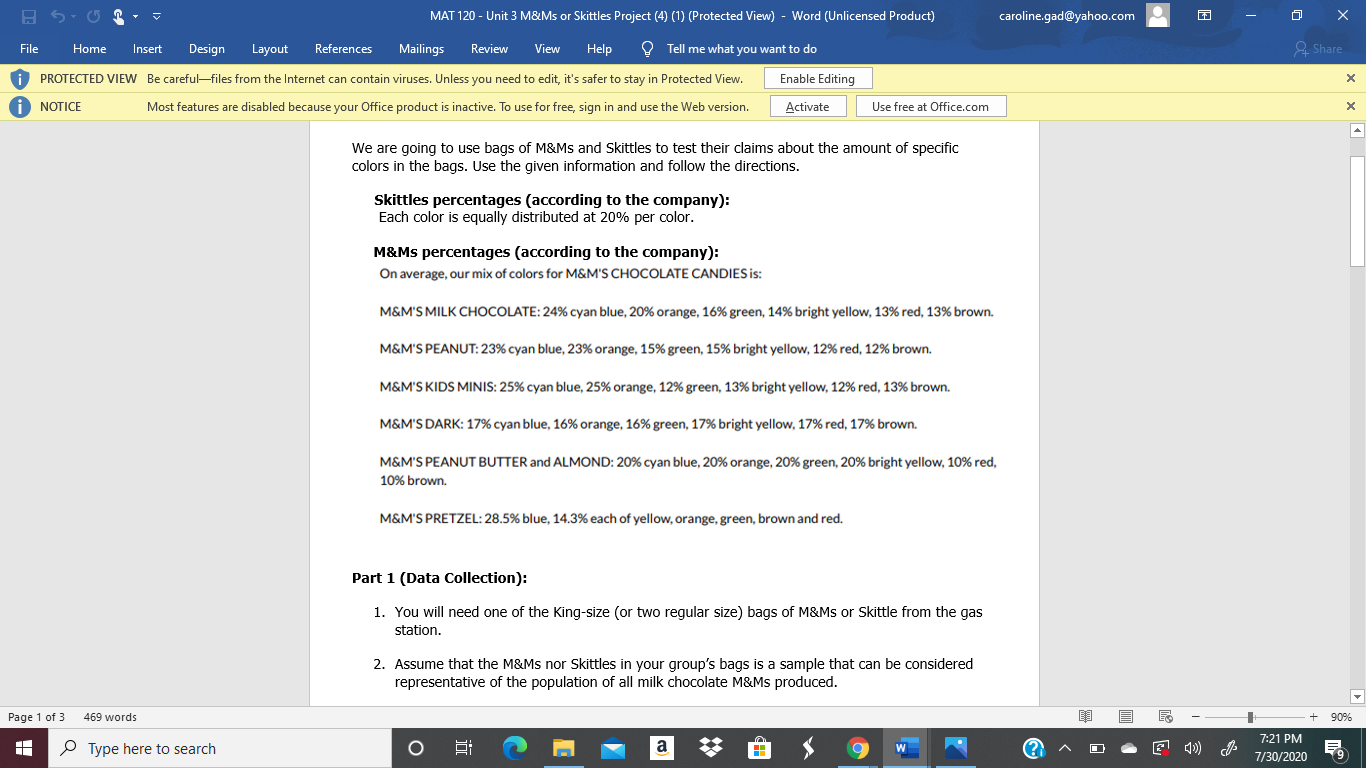
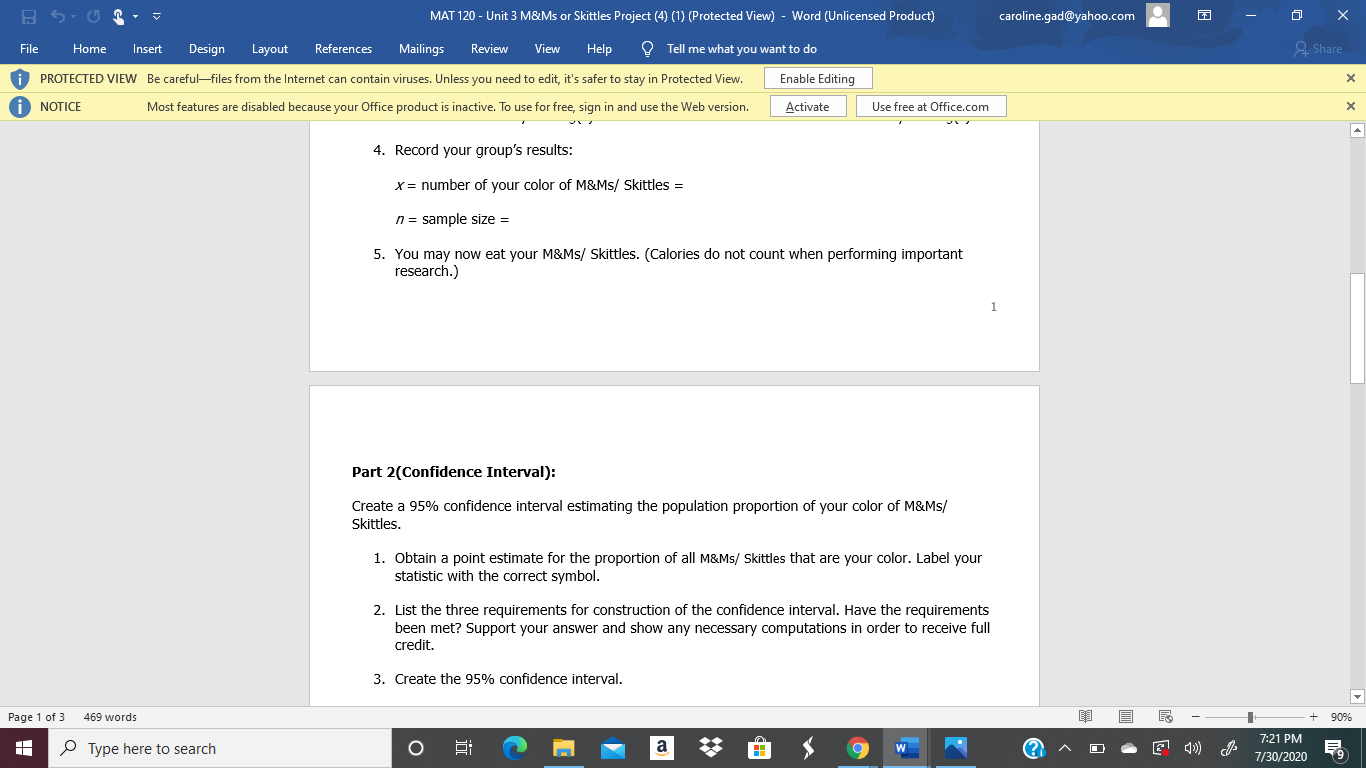
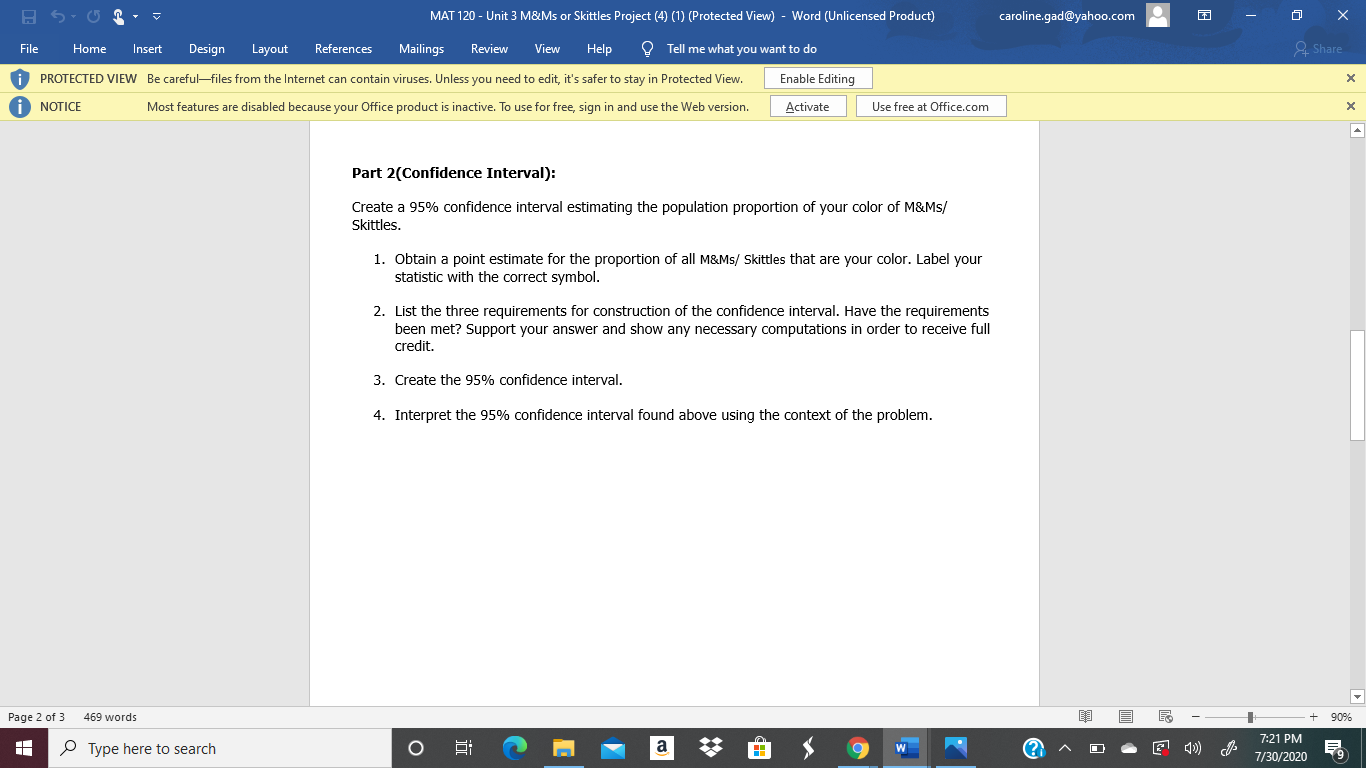
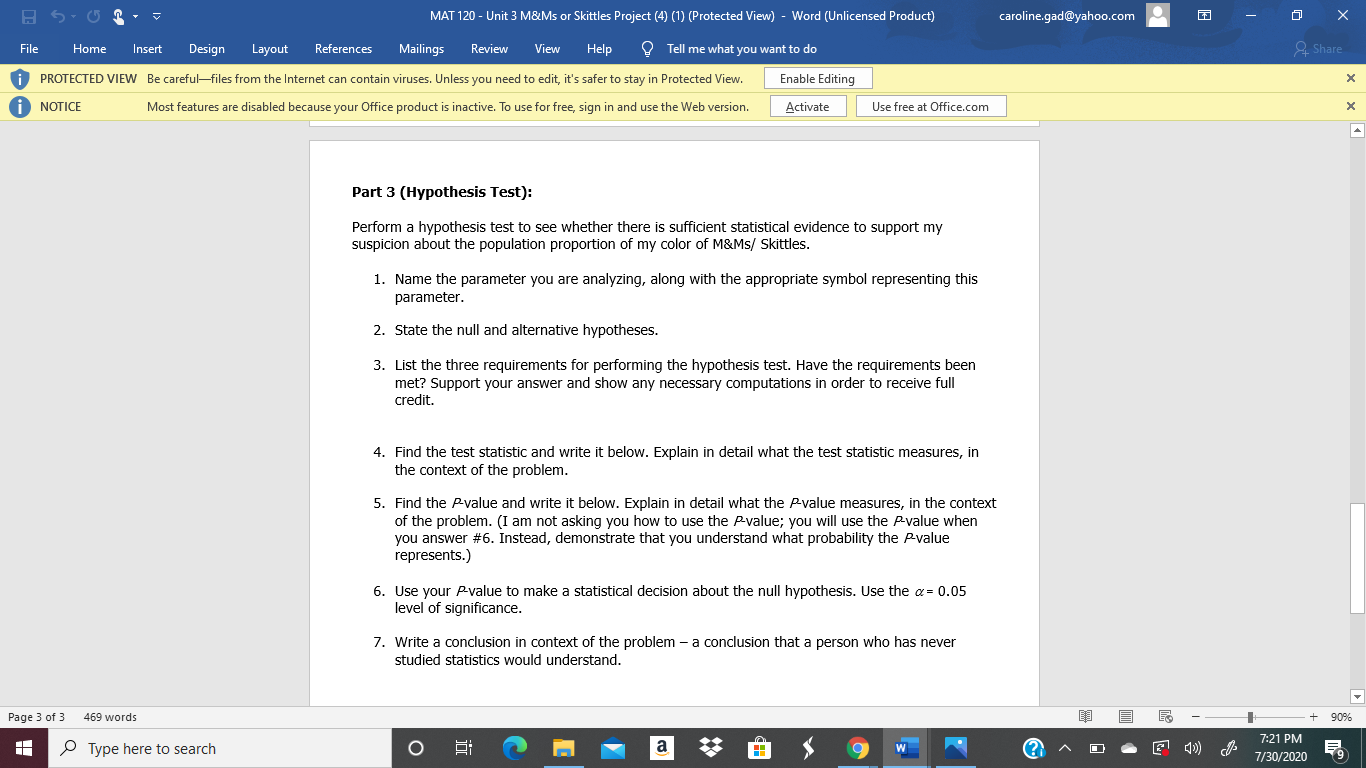
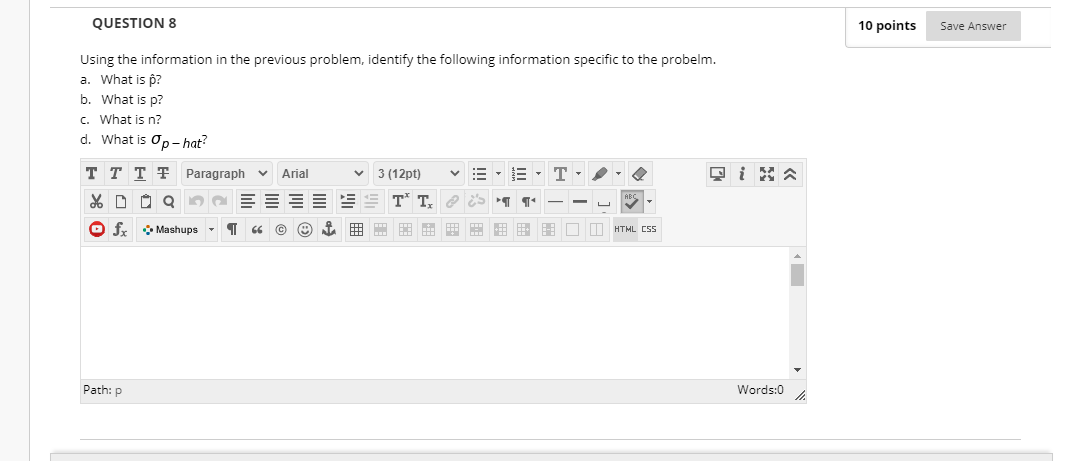
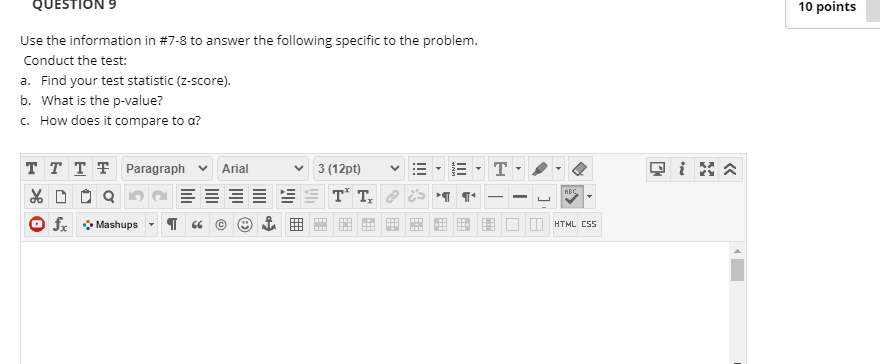
MAT 120 - Unit 3 M&Ms or Skittles Project (4) (1) (Protected View) - Word (Unlicensed Product) caroline.gad@yahoo.com X File Home Insert Design Layout References Mailings Review View Help Tell me what you want to do Share PROTECTED VIEW Be careful-files from the Internet can contain viruses. Unless you need to edit, it's safer to stay in Protected View. Enable Editing X i NOTICE Most features are disabled because your Office product is inactive. To use for free, sign in and use the Web version. Activate Use free at Office.com X We are going to use bags of M&Ms and Skittles to test their claims about the amount of specific colors in the bags. Use the given information and follow the directions. Skittles percentages (according to the company): Each color is equally distributed at 20% per color. M&Ms percentages (according to the company): On average, our mix of colors for M&M'S CHOCOLATE CANDIES is: M&M'S MILK CHOCOLATE: 24% cyan blue, 20% orange, 16% green, 14% bright yellow, 13% red, 13% brown. M&M'S PEANUT: 23% cyan blue, 23% orange, 15% green, 15% bright yellow, 12% red, 12% brown. M&M'S KIDS MINIS: 25% cyan blue, 25% orange, 12% green, 13% bright yellow, 12% red, 13% brown. M&M'S DARK: 17% cyan blue, 16% orange, 16% green, 17% bright yellow, 17% red, 17% brown. M&M'S PEANUT BUTTER and ALMOND: 20% cyan blue, 20% orange, 20% green, 20% bright yellow, 10% red, 10% brown. M&M'S PRETZEL: 28.5% blue, 14.3% each of yellow, orange, green, brown and red. Part 1 (Data Collection): 1. You will need one of the King-size (or two regular size) bags of M&Ms or Skittle from the gas station. 2. Assume that the M&Ms nor Skittles in your group's bags is a sample that can be considered representative of the population of all milk chocolate M&Ms produced. Page 1 of 3 469 words + 90% Type here to search O m a 9 W ? O 7:21 PM 7/30/2020MAT 120 - Unit 3 M&Ms or Skittles Project (4) (1) (Protected View) - Word (Unlicensed Product) caroline.gad@yahoo.com X File Home Insert Design Layout References Mailings Review View Help Tell me what you want to do Share PROTECTED VIEW Be careful-files from the Internet can contain viruses. Unless you need to edit, it's safer to stay in Protected View. Enable Editing X i NOTICE Most features are disabled because your Office product is inactive. To use for free, sign in and use the Web version. Activate Use free at Office.com X 4. Record your group's results: x = number of your color of M&Ms/ Skittles = n = sample size = 5. You may now eat your M&Ms/ Skittles. (Calories do not count when performing important research.) 1 Part 2(Confidence Interval): Create a 95% confidence interval estimating the population proportion of your color of M&Ms/ Skittles. 1. Obtain a point estimate for the proportion of all M&Ms/ Skittles that are your color. Label your statistic with the correct symbol. 2. List the three requirements for construction of the confidence interval. Have the requirements been met? Support your answer and show any necessary computations in order to receive full credit. 3. Create the 95% confidence interval. Page 1 of 3 469 words + 90% Type here to search O M a W ? 7:21 PM 7/30/2020MAT 120 - Unit 3 M&Ms or Skittles Project (4) (1) (Protected View) - Word (Unlicensed Product) caroline.gad@yahoo.com X File Home Insert Design Layout References Mailings Review View Help Tell me what you want to do Share PROTECTED VIEW Be careful-files from the Internet can contain viruses. Unless you need to edit, it's safer to stay in Protected View. Enable Editing X i NOTICE Most features are disabled because your Office product is inactive. To use for free, sign in and use the Web version. Activate Use free at Office.com X Part 2(Confidence Interval): Create a 95% confidence interval estimating the population proportion of your color of M&Ms/ Skittles. 1. Obtain a point estimate for the proportion of all M&Ms/ Skittles that are your color. Label your statistic with the correct symbol. 2. List the three requirements for construction of the confidence interval. Have the requirements been met? Support your answer and show any necessary computations in order to receive full credit. 3. Create the 95% confidence interval. 4. Interpret the 95% confidence interval found above using the context of the problem. Page 2 of 3 469 words + 90% Type here to search w O 7:21 PM 7/30/2020MAT 120 - Unit 3 M&Ms or Skittles Project (4) (1) (Protected View) - Word (Unlicensed Product) caroline.gad@yahoo.com X File Home Insert Design Layout References Mailings Review View Help Tell me what you want to do Share PROTECTED VIEW Be careful-files from the Internet can contain viruses. Unless you need to edit, it's safer to stay in Protected View. Enable Editing X i NOTICE Most features are disabled because your Office product is inactive. To use for free, sign in and use the Web version. Activate Use free at Office.com X Part 3 (Hypothesis Test): Perform a hypothesis test to see whether there is sufficient statistical evidence to support my suspicion about the population proportion of my color of M&Ms/ Skittles. 1. Name the parameter you are analyzing, along with the appropriate symbol representing this parameter. 2. State the null and alternative hypotheses. 3. List the three requirements for performing the hypothesis test. Have the requirements been met? Support your answer and show any necessary computations in order to receive full credit. 4. Find the test statistic and write it below. Explain in detail what the test statistic measures, in the context of the problem. 5. Find the Avalue and write it below. Explain in detail what the Avalue measures, in the context of the problem. (I am not asking you how to use the Avalue; you will use the Avalue when you answer #6. Instead, demonstrate that you understand what probability the Avalue represents.) 6. Use your Pvalue to make a statistical decision about the null hypothesis. Use the a = 0.05 level of significance. 7. Write a conclusion in context of the problem - a conclusion that a person who has never studied statistics would understand. Page 3 of 3 469 words + 90% Type here to search O a 9 W ? 7:21 PM 7/30/2020QUESTION 8 10 points Save Answer Using the information in the previous problem, identify the following information specific to the probelm. a. What is p? b. What is p? c. What is n? d. What is Up - hat? TTTT Paragraph v Arial 3 (12pt) = T X D D Q E E T T. T T4 ABC fx Mashups IT C TA HTML CSS Path: p Words:0QUESTION 9 10 points Use the information in #7-8 to answer the following specific to the problem. Conduct the test: a. Find your test statistic (z-score). b. What is the p-value? c. How does it compare to a? TTTT Paragraph Arial V 3 (12pt) = T T i Ka X D D Q E E T T. HE Ofx Mashups C HTML CSSPath: p Words:0 QUESTION 10 10 points What is the conclusion of your test in #9? TTTF Paragraph v Arial 3 (12pt) T X D Q Q E E E T T. ABC Ofx Mashups C H H+ HTML CSS Path: p Words:0\f
Step by Step Solution
There are 3 Steps involved in it

Get step-by-step solutions from verified subject matter experts