

Question: Match and Error Handling The table on the CityData worksheet contains demographic information about several large US cities. Complete the tasks to use the drop-down
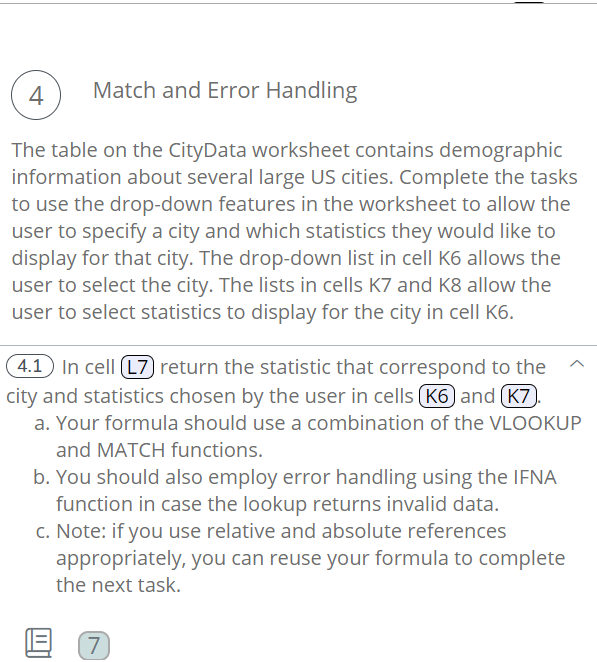
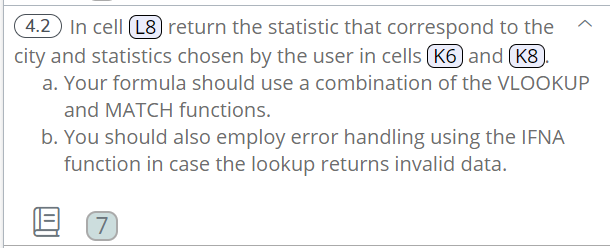
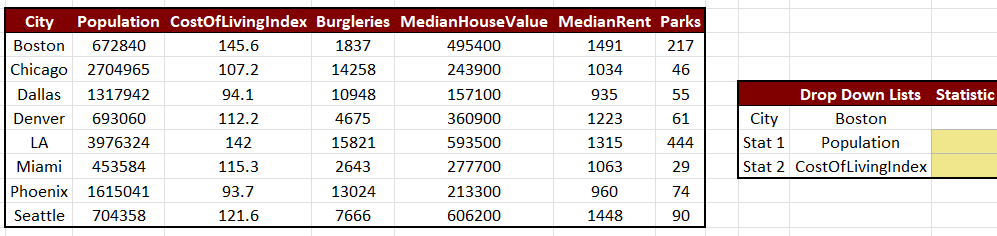
Match and Error Handling The table on the CityData worksheet contains demographic information about several large US cities. Complete the tasks to use the drop-down features in the worksheet to allow the user to specify a city and which statistics they would like to display for that city. The drop-down list in cell K6 allows the user to select the city. The lists in cells K7 and K8 allow the user to select statistics to display for the city in cell K6. city and statistics chosen by the user in cells K6 and K7. a. Your formula should use a combination of the VLOOKUP and MATCH functions. b. You should also employ error handling using the IFNA function in case the lookup returns invalid data. c. Note: if you use relative and absolute references appropriately, you can reuse your formula to complete the next task. 4.2 In cell L8 return the statistic that correspond to the city and statistics chosen by the user in cells K6 and K8. a. Your formula should use a combination of the VLOOKUP and MATCH functions. b. You should also employ error handling using the IFNA function in case the lookup returns invalid data. \begin{tabular}{|c|c|c|c|c|c|c|c|} \hline City & Population & CostOfLivingIndex & Burgleries & MedianHouseValue & MedianRent Parks \\ \hline Boston & 672840 & 145.6 & 1837 & 495400 & 1491 & 217 \\ \hline Chicago & 2704965 & 107.2 & 14258 & 243900 & 1034 & 46 \\ \hline Dallas & 1317942 & 94.1 & 10948 & 157100 & 935 & 55 \\ \hline Denver & 693060 & 112.2 & 4675 & 360900 & 1223 & 61 \\ \hline LA & 3976324 & 142 & 15821 & 593500 & 1315 & 444 \\ \hline Miami & 453584 & 115.3 & 2643 & 277700 & 1063 & 29 \\ \hline Phoenix & 1615041 & 93.7 & 13024 & 213300 & 960 & 74 \\ \hline Seattle & 704358 & 121.6 & 7666 & 606200 & 1448 & 90 \\ \hline \end{tabular} Drop Down Lists Statistic City Boston Stat 1 Population Stat 2 CostOfLivingIndex Match and Error Handling The table on the CityData worksheet contains demographic information about several large US cities. Complete the tasks to use the drop-down features in the worksheet to allow the user to specify a city and which statistics they would like to display for that city. The drop-down list in cell K6 allows the user to select the city. The lists in cells K7 and K8 allow the user to select statistics to display for the city in cell K6. city and statistics chosen by the user in cells K6 and K7. a. Your formula should use a combination of the VLOOKUP and MATCH functions. b. You should also employ error handling using the IFNA function in case the lookup returns invalid data. c. Note: if you use relative and absolute references appropriately, you can reuse your formula to complete the next task. 4.2 In cell L8 return the statistic that correspond to the city and statistics chosen by the user in cells K6 and K8. a. Your formula should use a combination of the VLOOKUP and MATCH functions. b. You should also employ error handling using the IFNA function in case the lookup returns invalid data. \begin{tabular}{|c|c|c|c|c|c|c|c|} \hline City & Population & CostOfLivingIndex & Burgleries & MedianHouseValue & MedianRent Parks \\ \hline Boston & 672840 & 145.6 & 1837 & 495400 & 1491 & 217 \\ \hline Chicago & 2704965 & 107.2 & 14258 & 243900 & 1034 & 46 \\ \hline Dallas & 1317942 & 94.1 & 10948 & 157100 & 935 & 55 \\ \hline Denver & 693060 & 112.2 & 4675 & 360900 & 1223 & 61 \\ \hline LA & 3976324 & 142 & 15821 & 593500 & 1315 & 444 \\ \hline Miami & 453584 & 115.3 & 2643 & 277700 & 1063 & 29 \\ \hline Phoenix & 1615041 & 93.7 & 13024 & 213300 & 960 & 74 \\ \hline Seattle & 704358 & 121.6 & 7666 & 606200 & 1448 & 90 \\ \hline \end{tabular} Drop Down Lists Statistic City Boston Stat 1 Population Stat 2 CostOfLivingIndex
Step by Step Solution
There are 3 Steps involved in it

Get step-by-step solutions from verified subject matter experts