

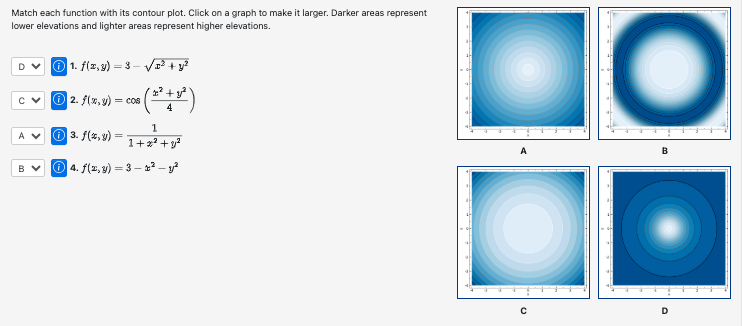
Question: Match each function with its contour plot. Click o n a graph t o make i t larger. Darker areas represent lower elevations and lighter
Match each function with its contour plot. Click a graph make larger. Darker areas represent
lower elevations and lighter areas represent higher elevations.
Step by Step Solution
There are 3 Steps involved in it
1 Expert Approved Answer
Step: 1 Unlock

Question Has Been Solved by an Expert!
Get step-by-step solutions from verified subject matter experts
Step: 2 Unlock
Step: 3 Unlock