

Question: Match each scatterplot shown below with one of the four specified correlations. O a. 0.97 b. 0.51 c. 0.05 O O - E d. -0.93


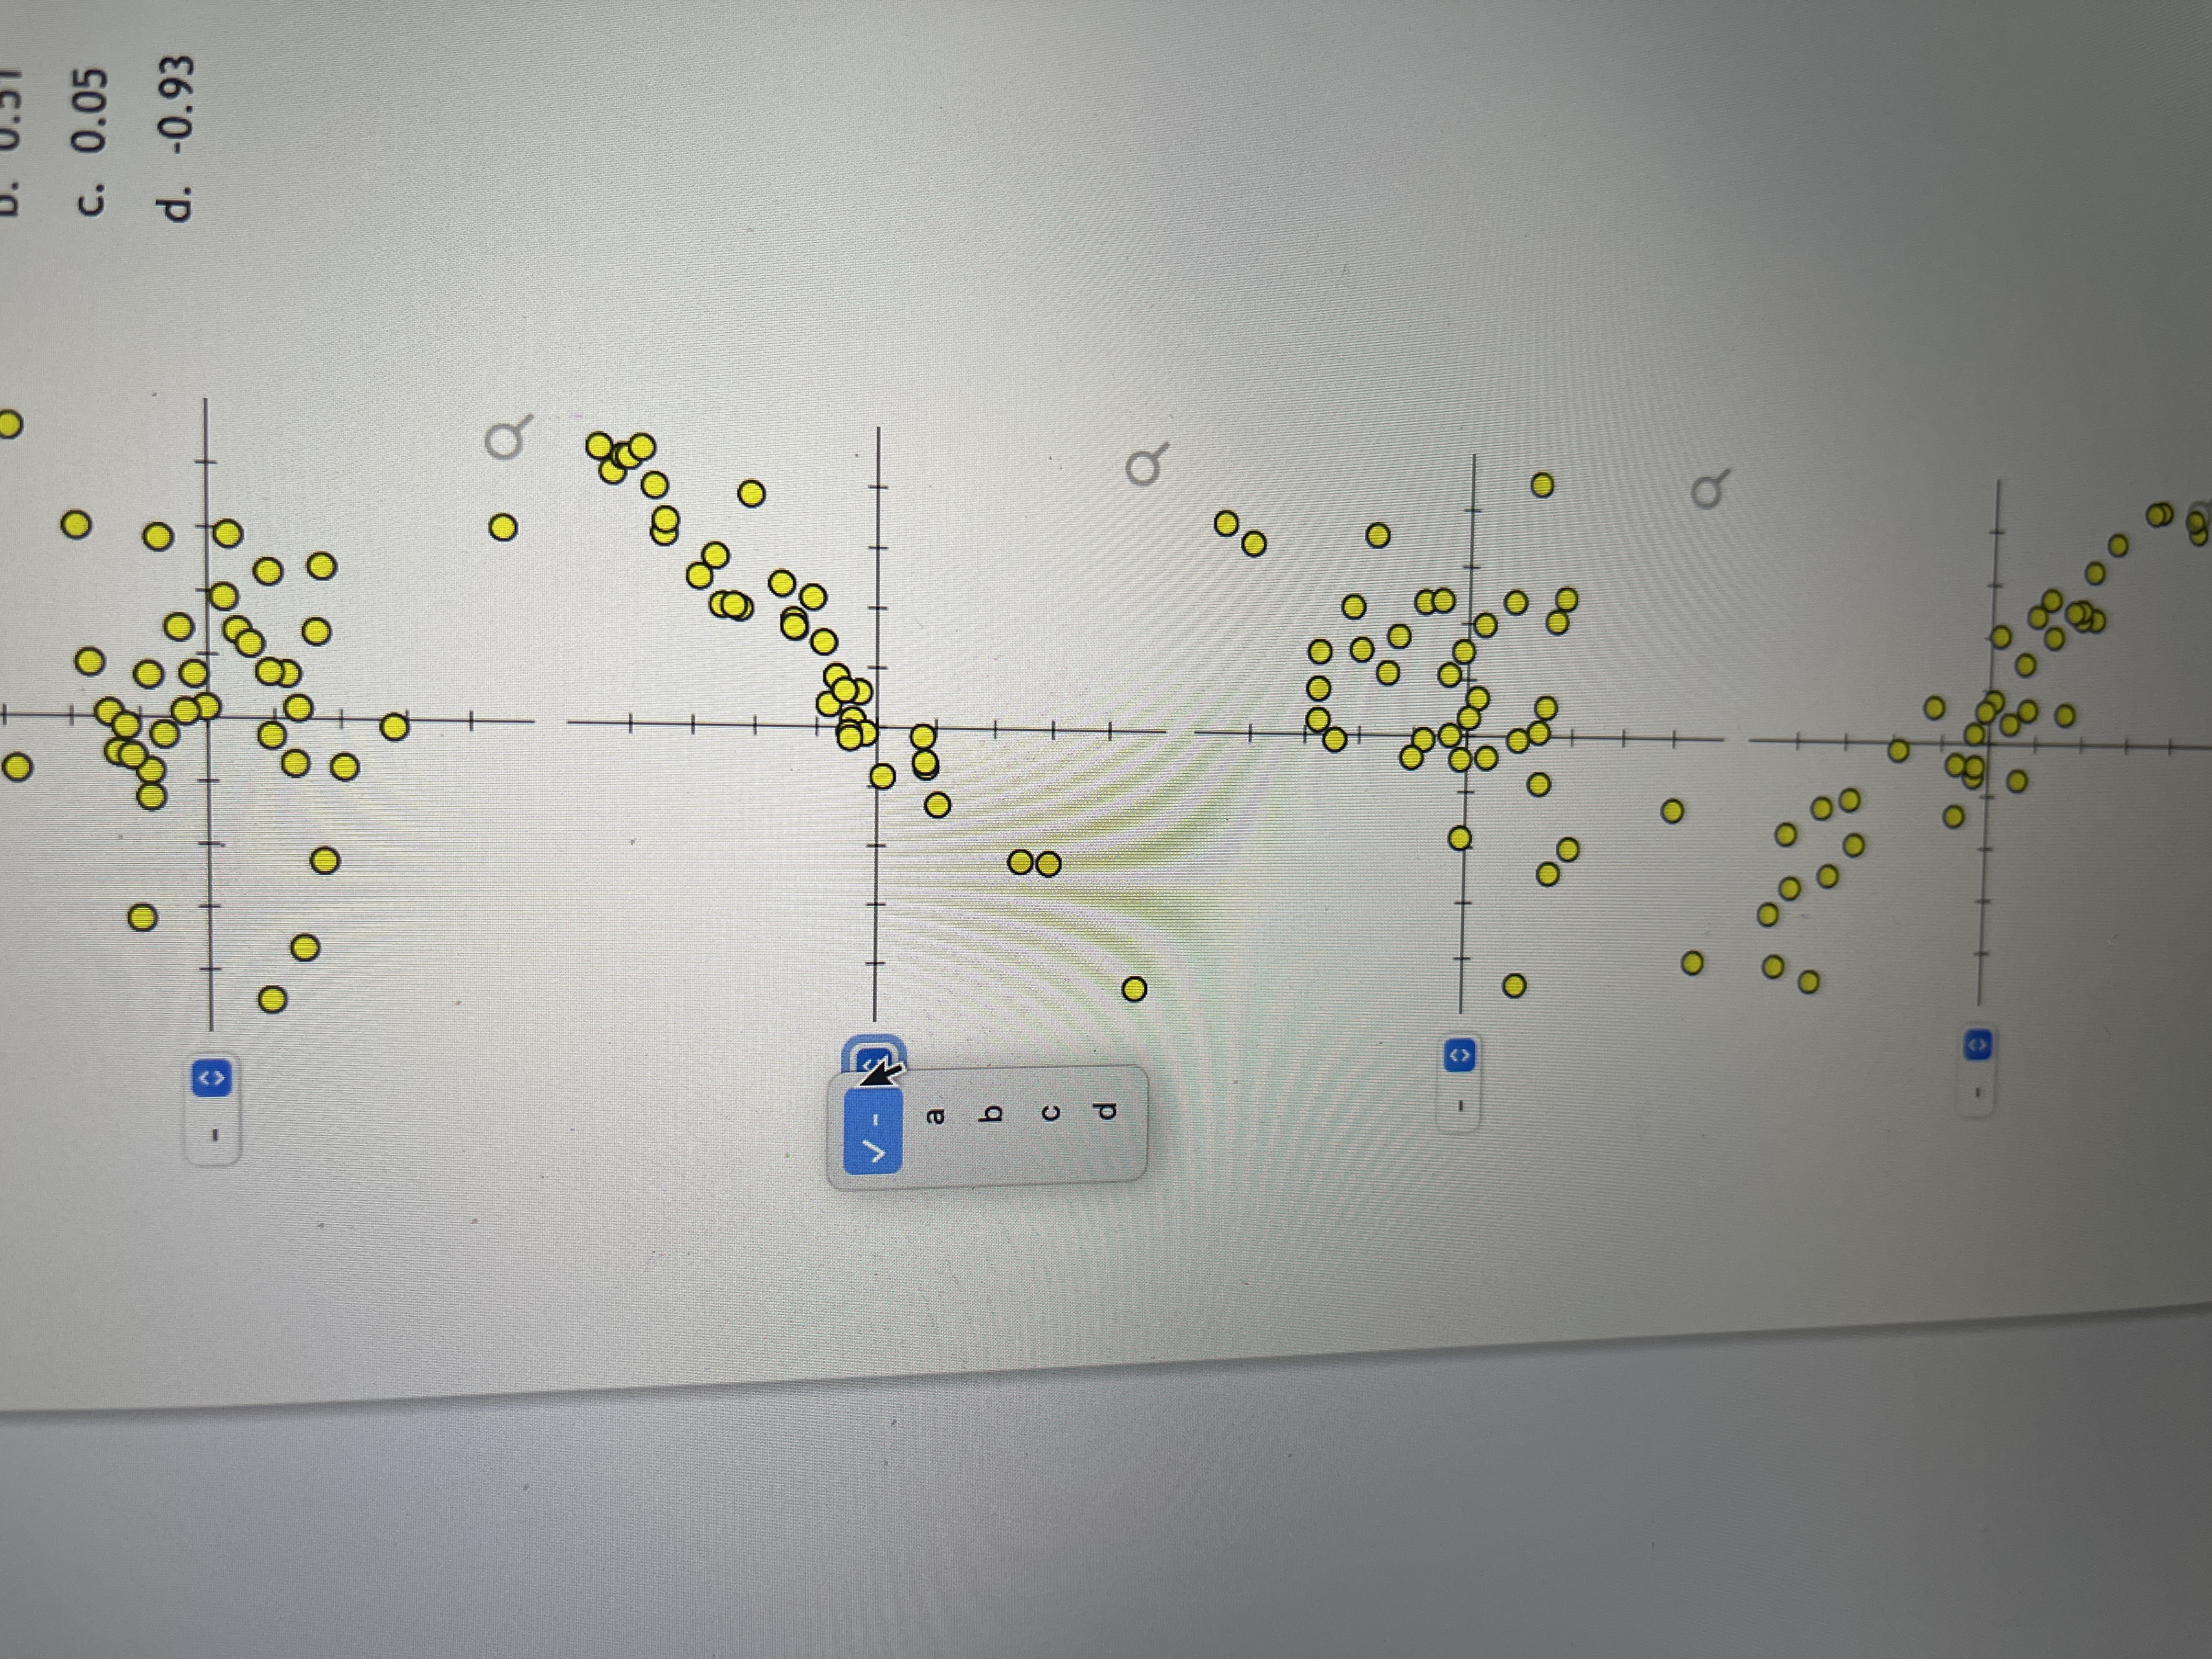

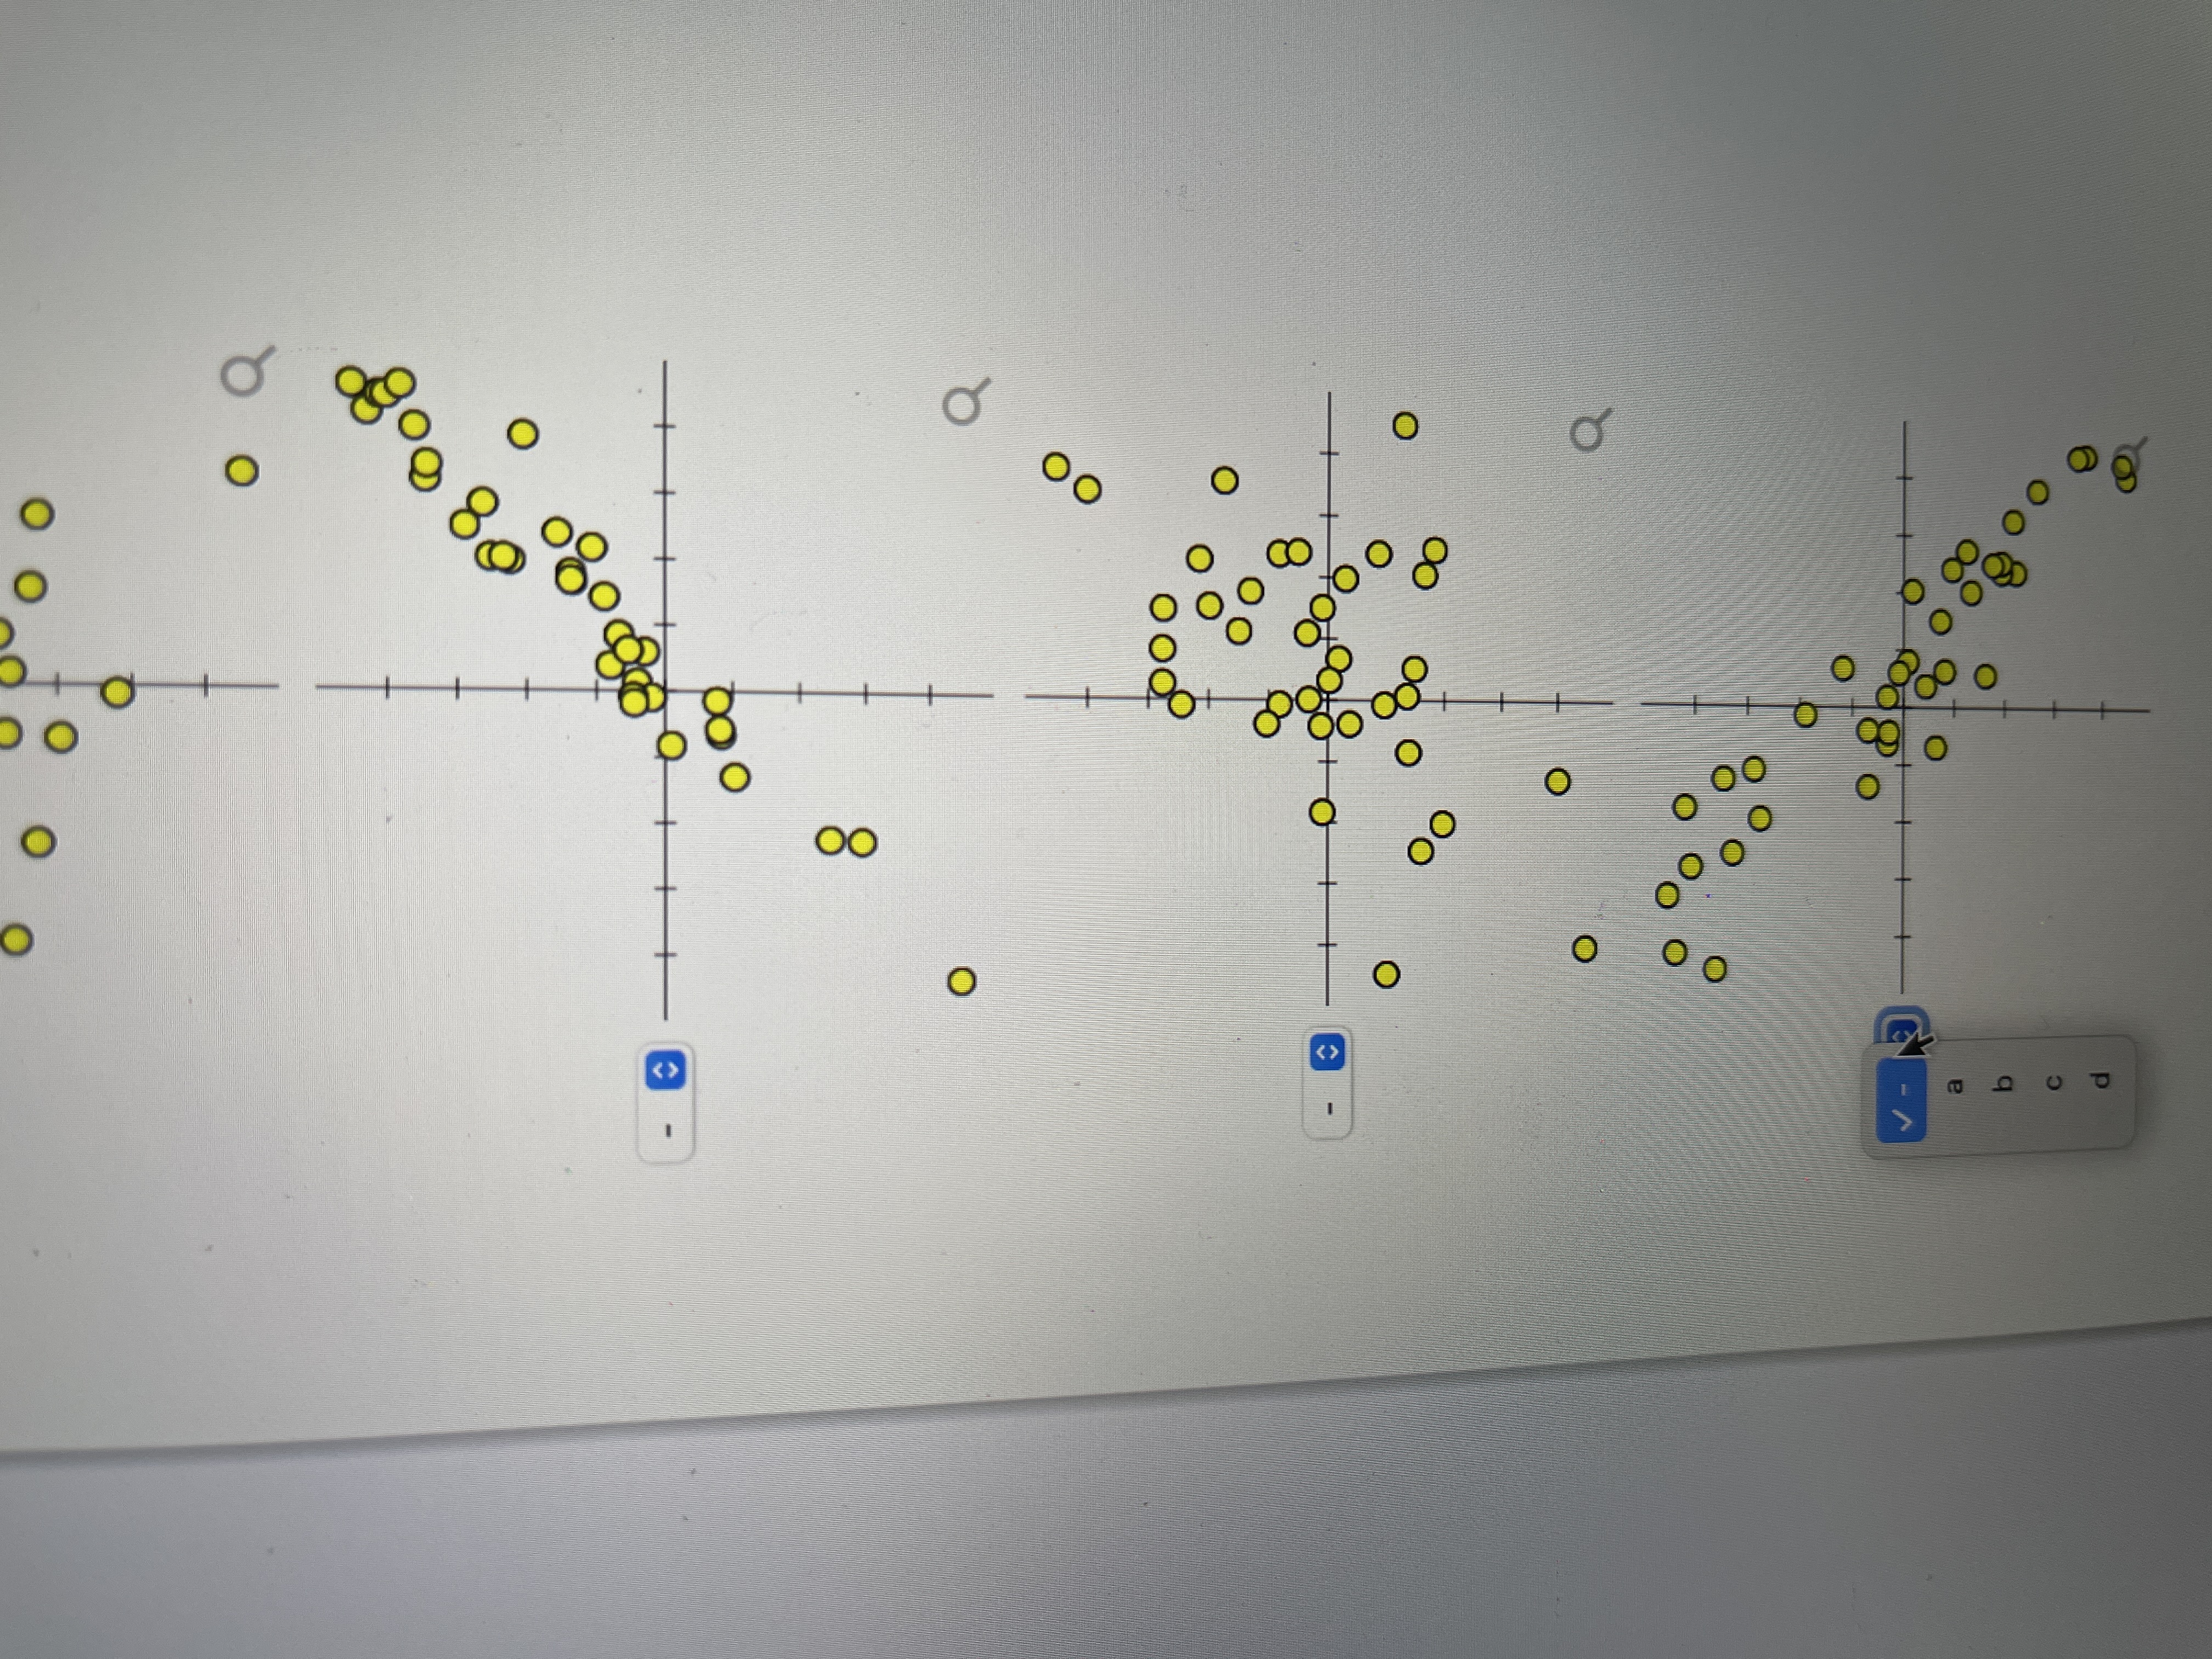
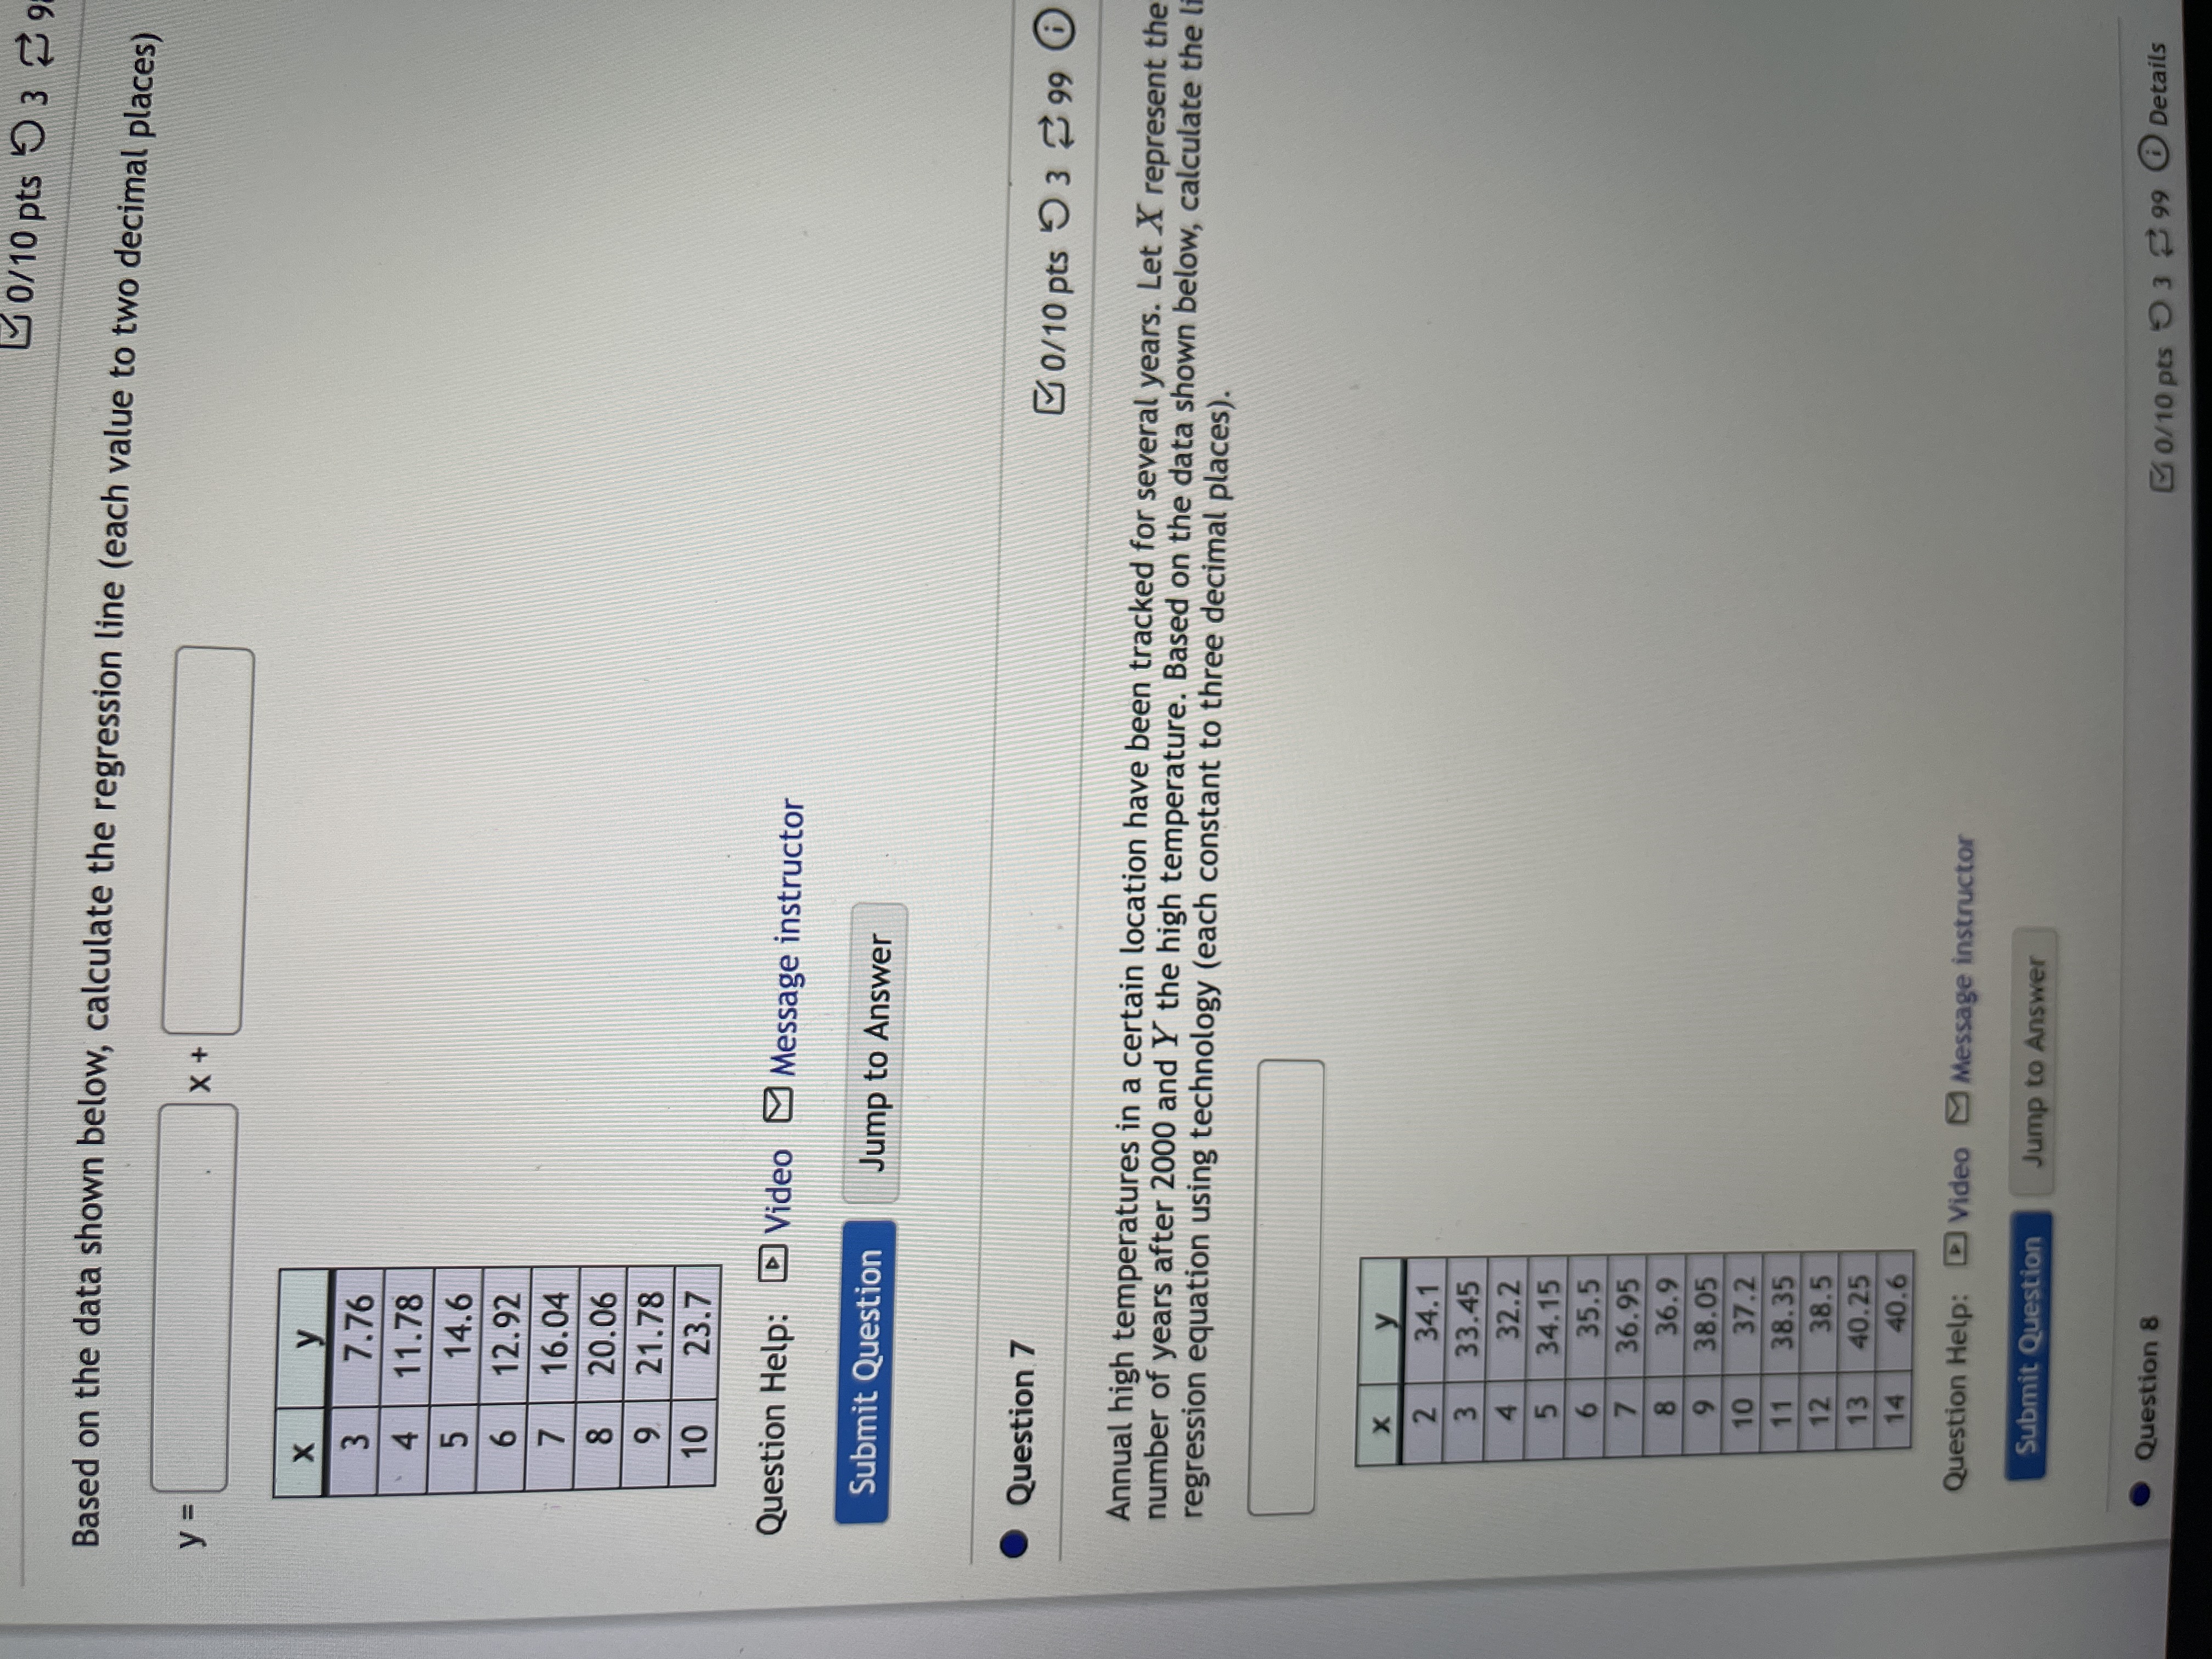

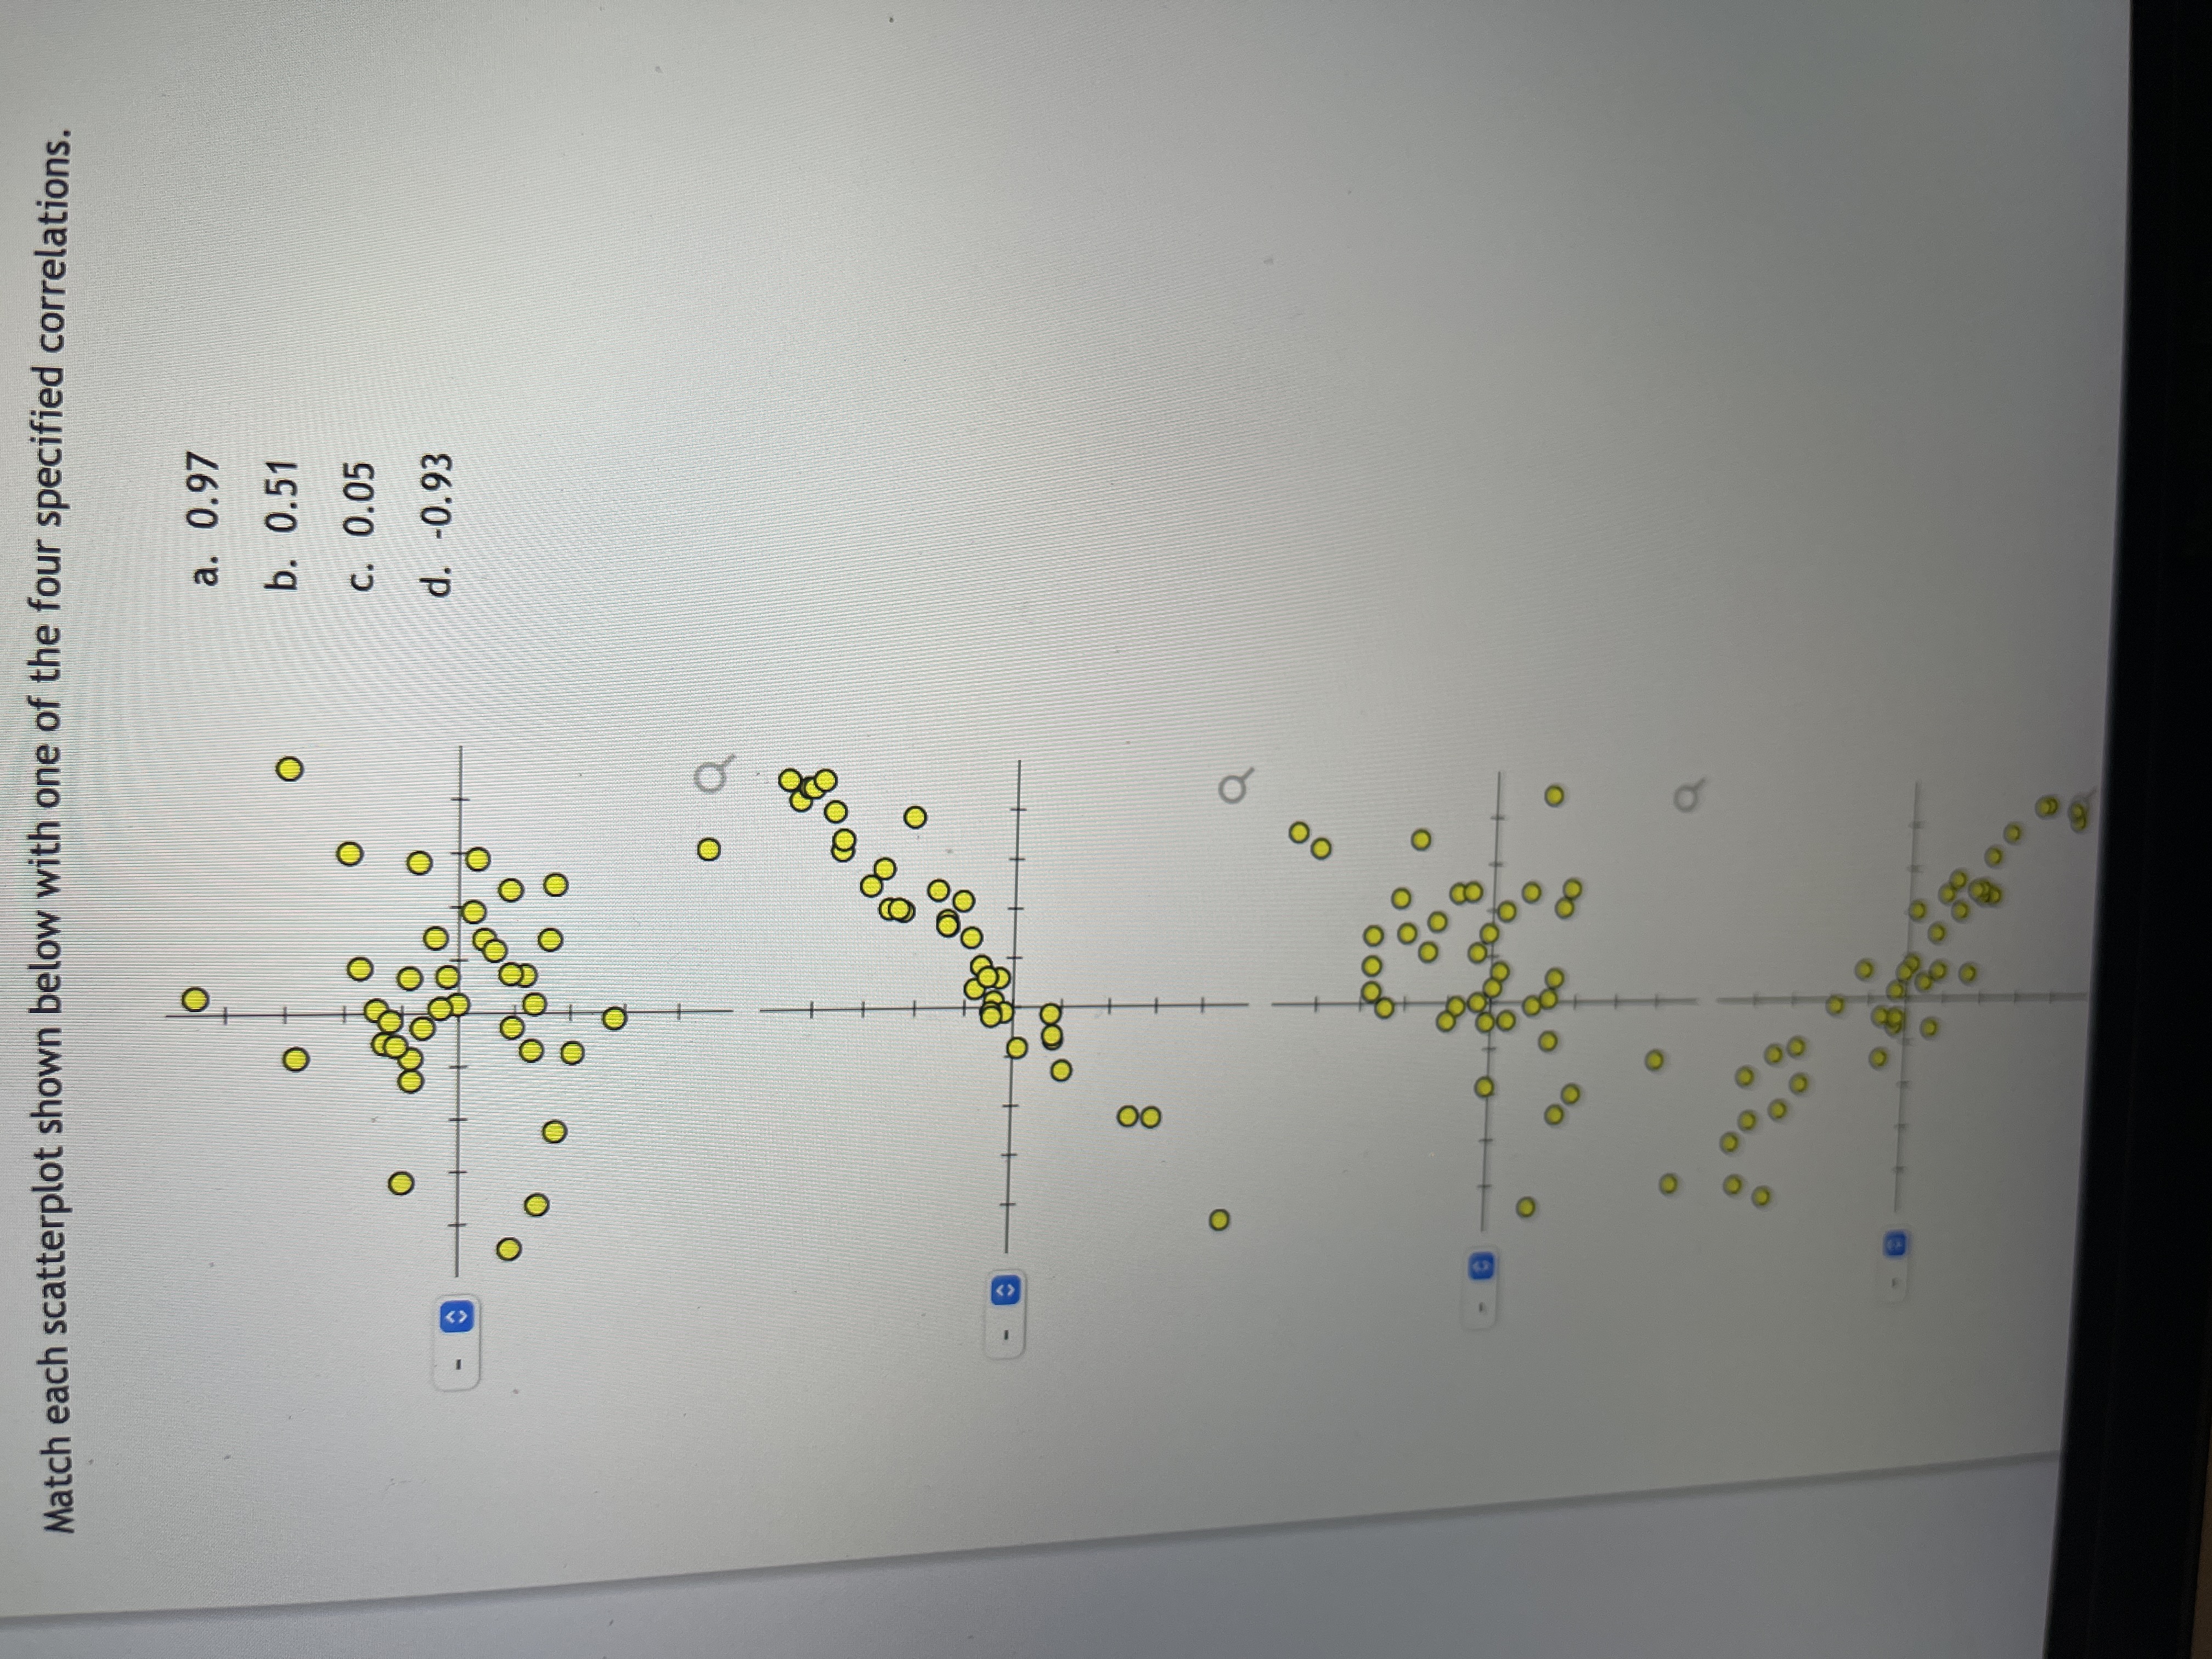
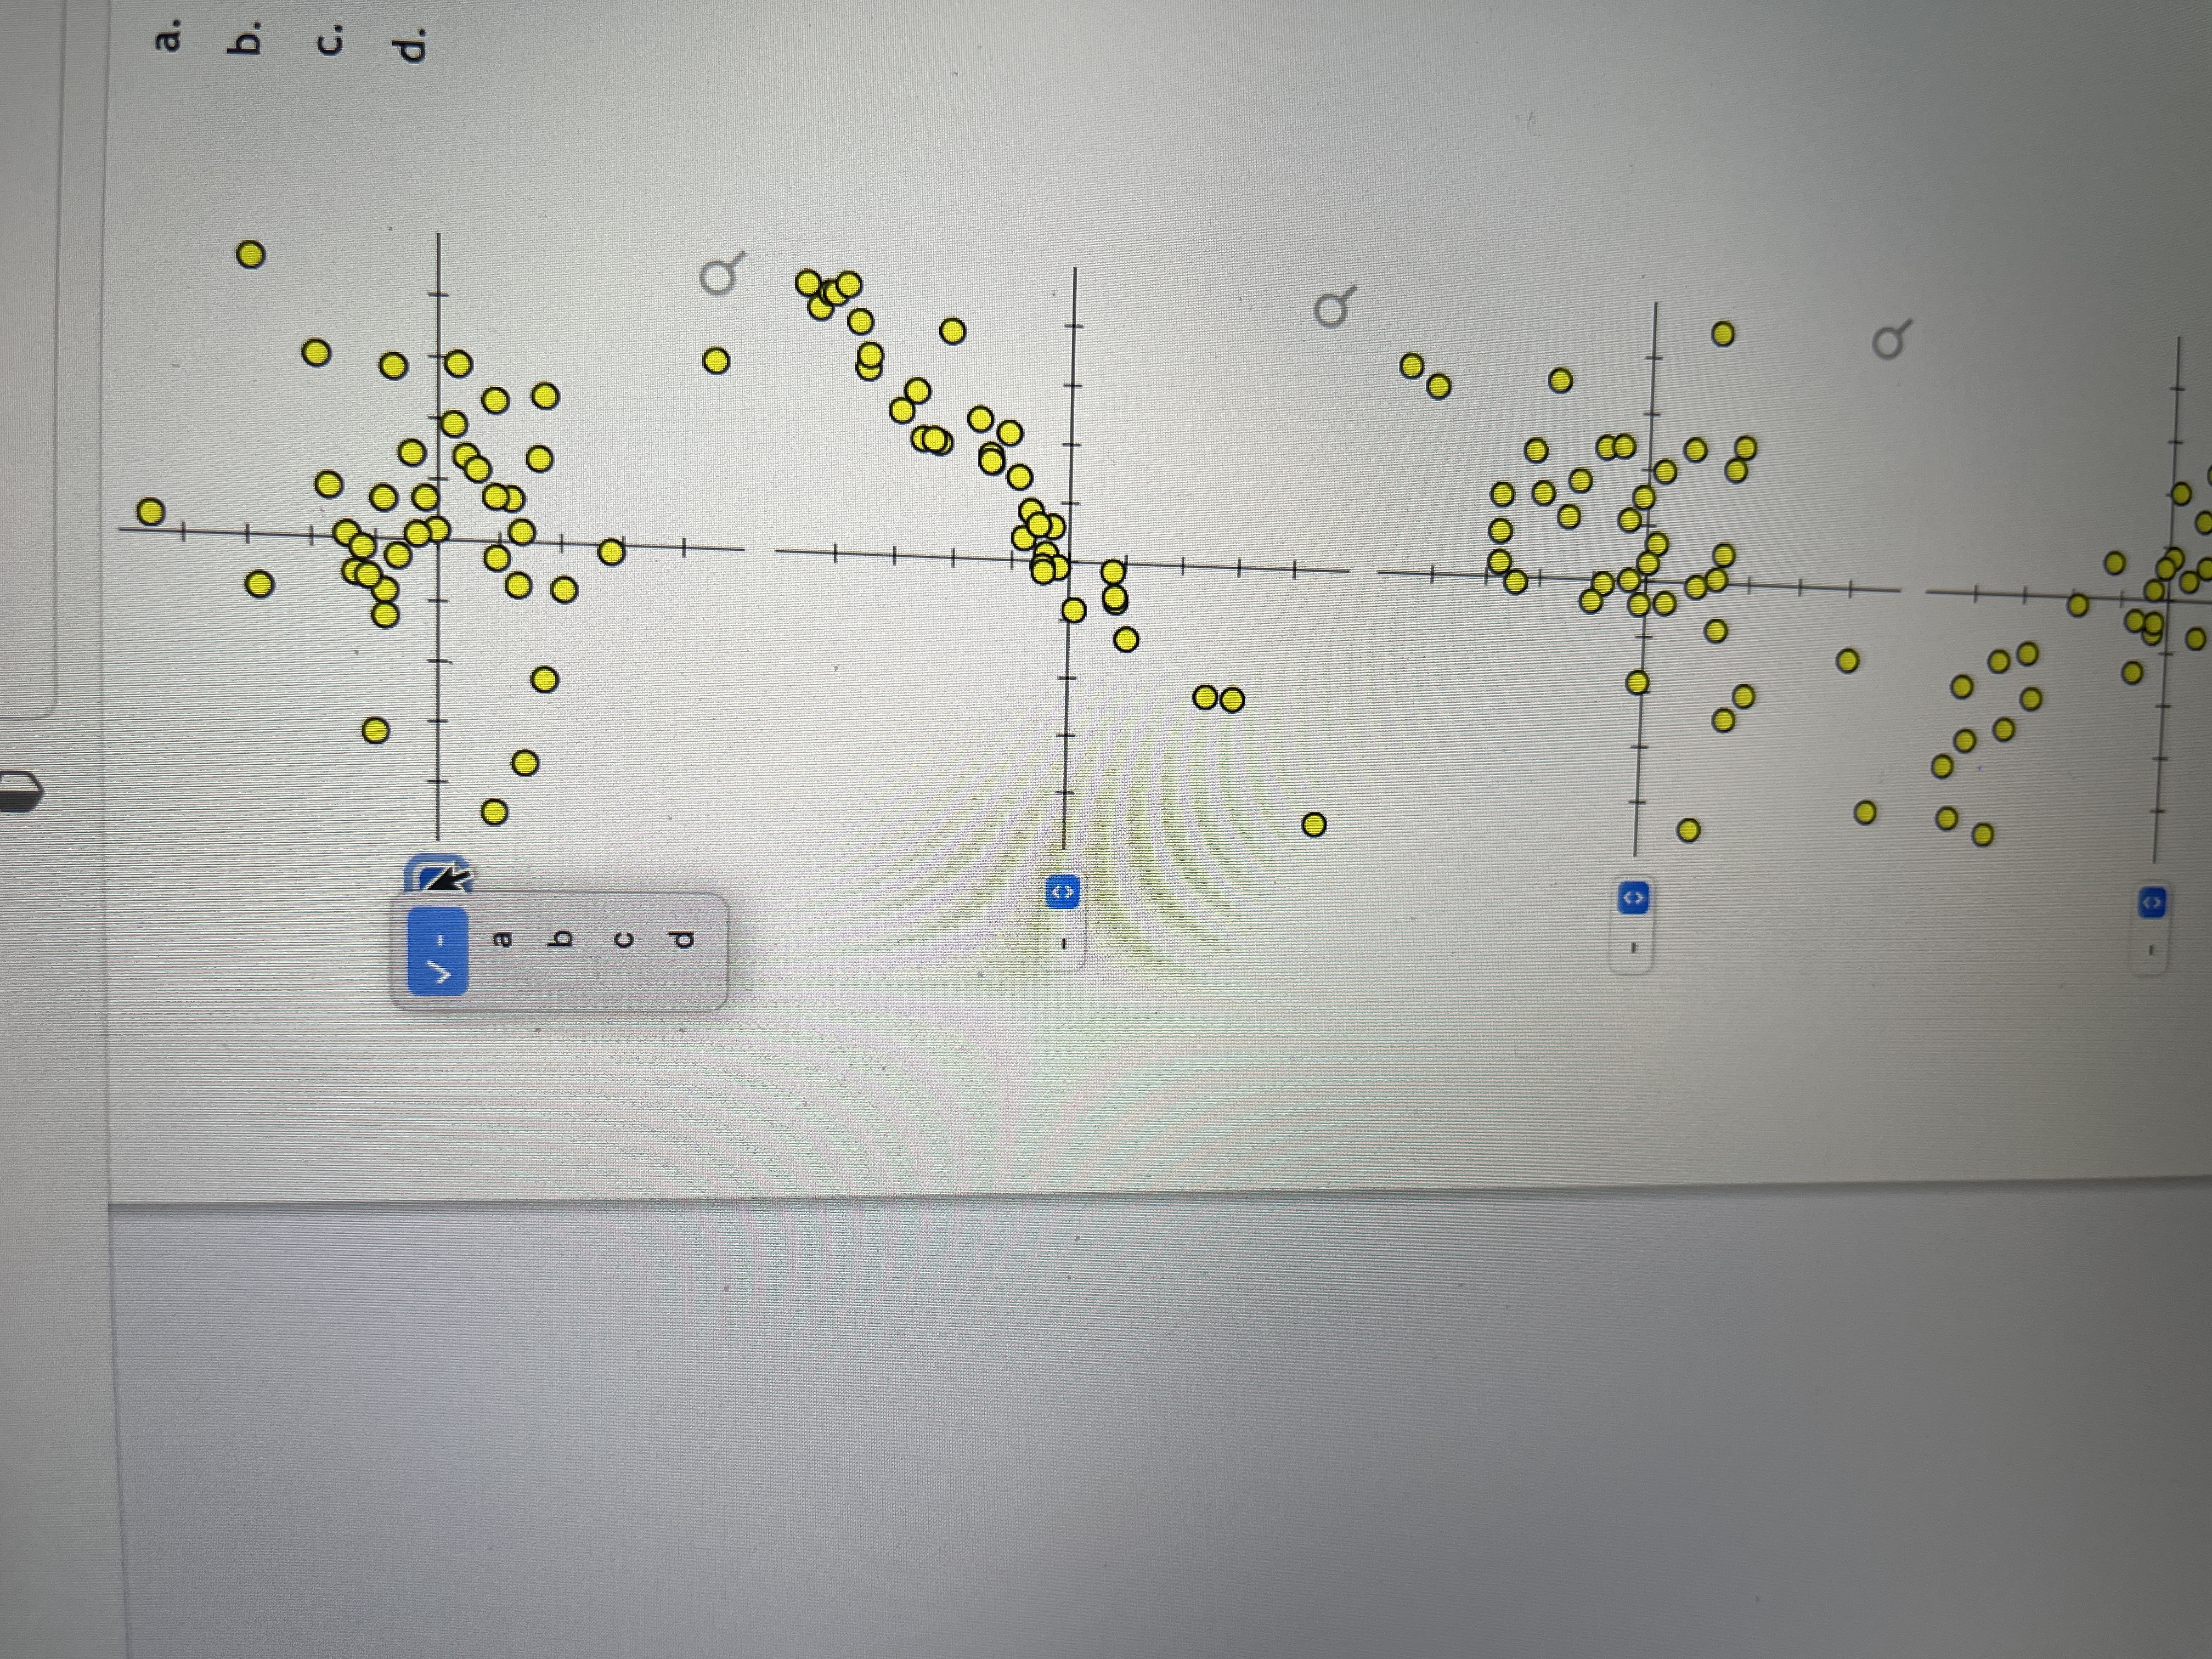

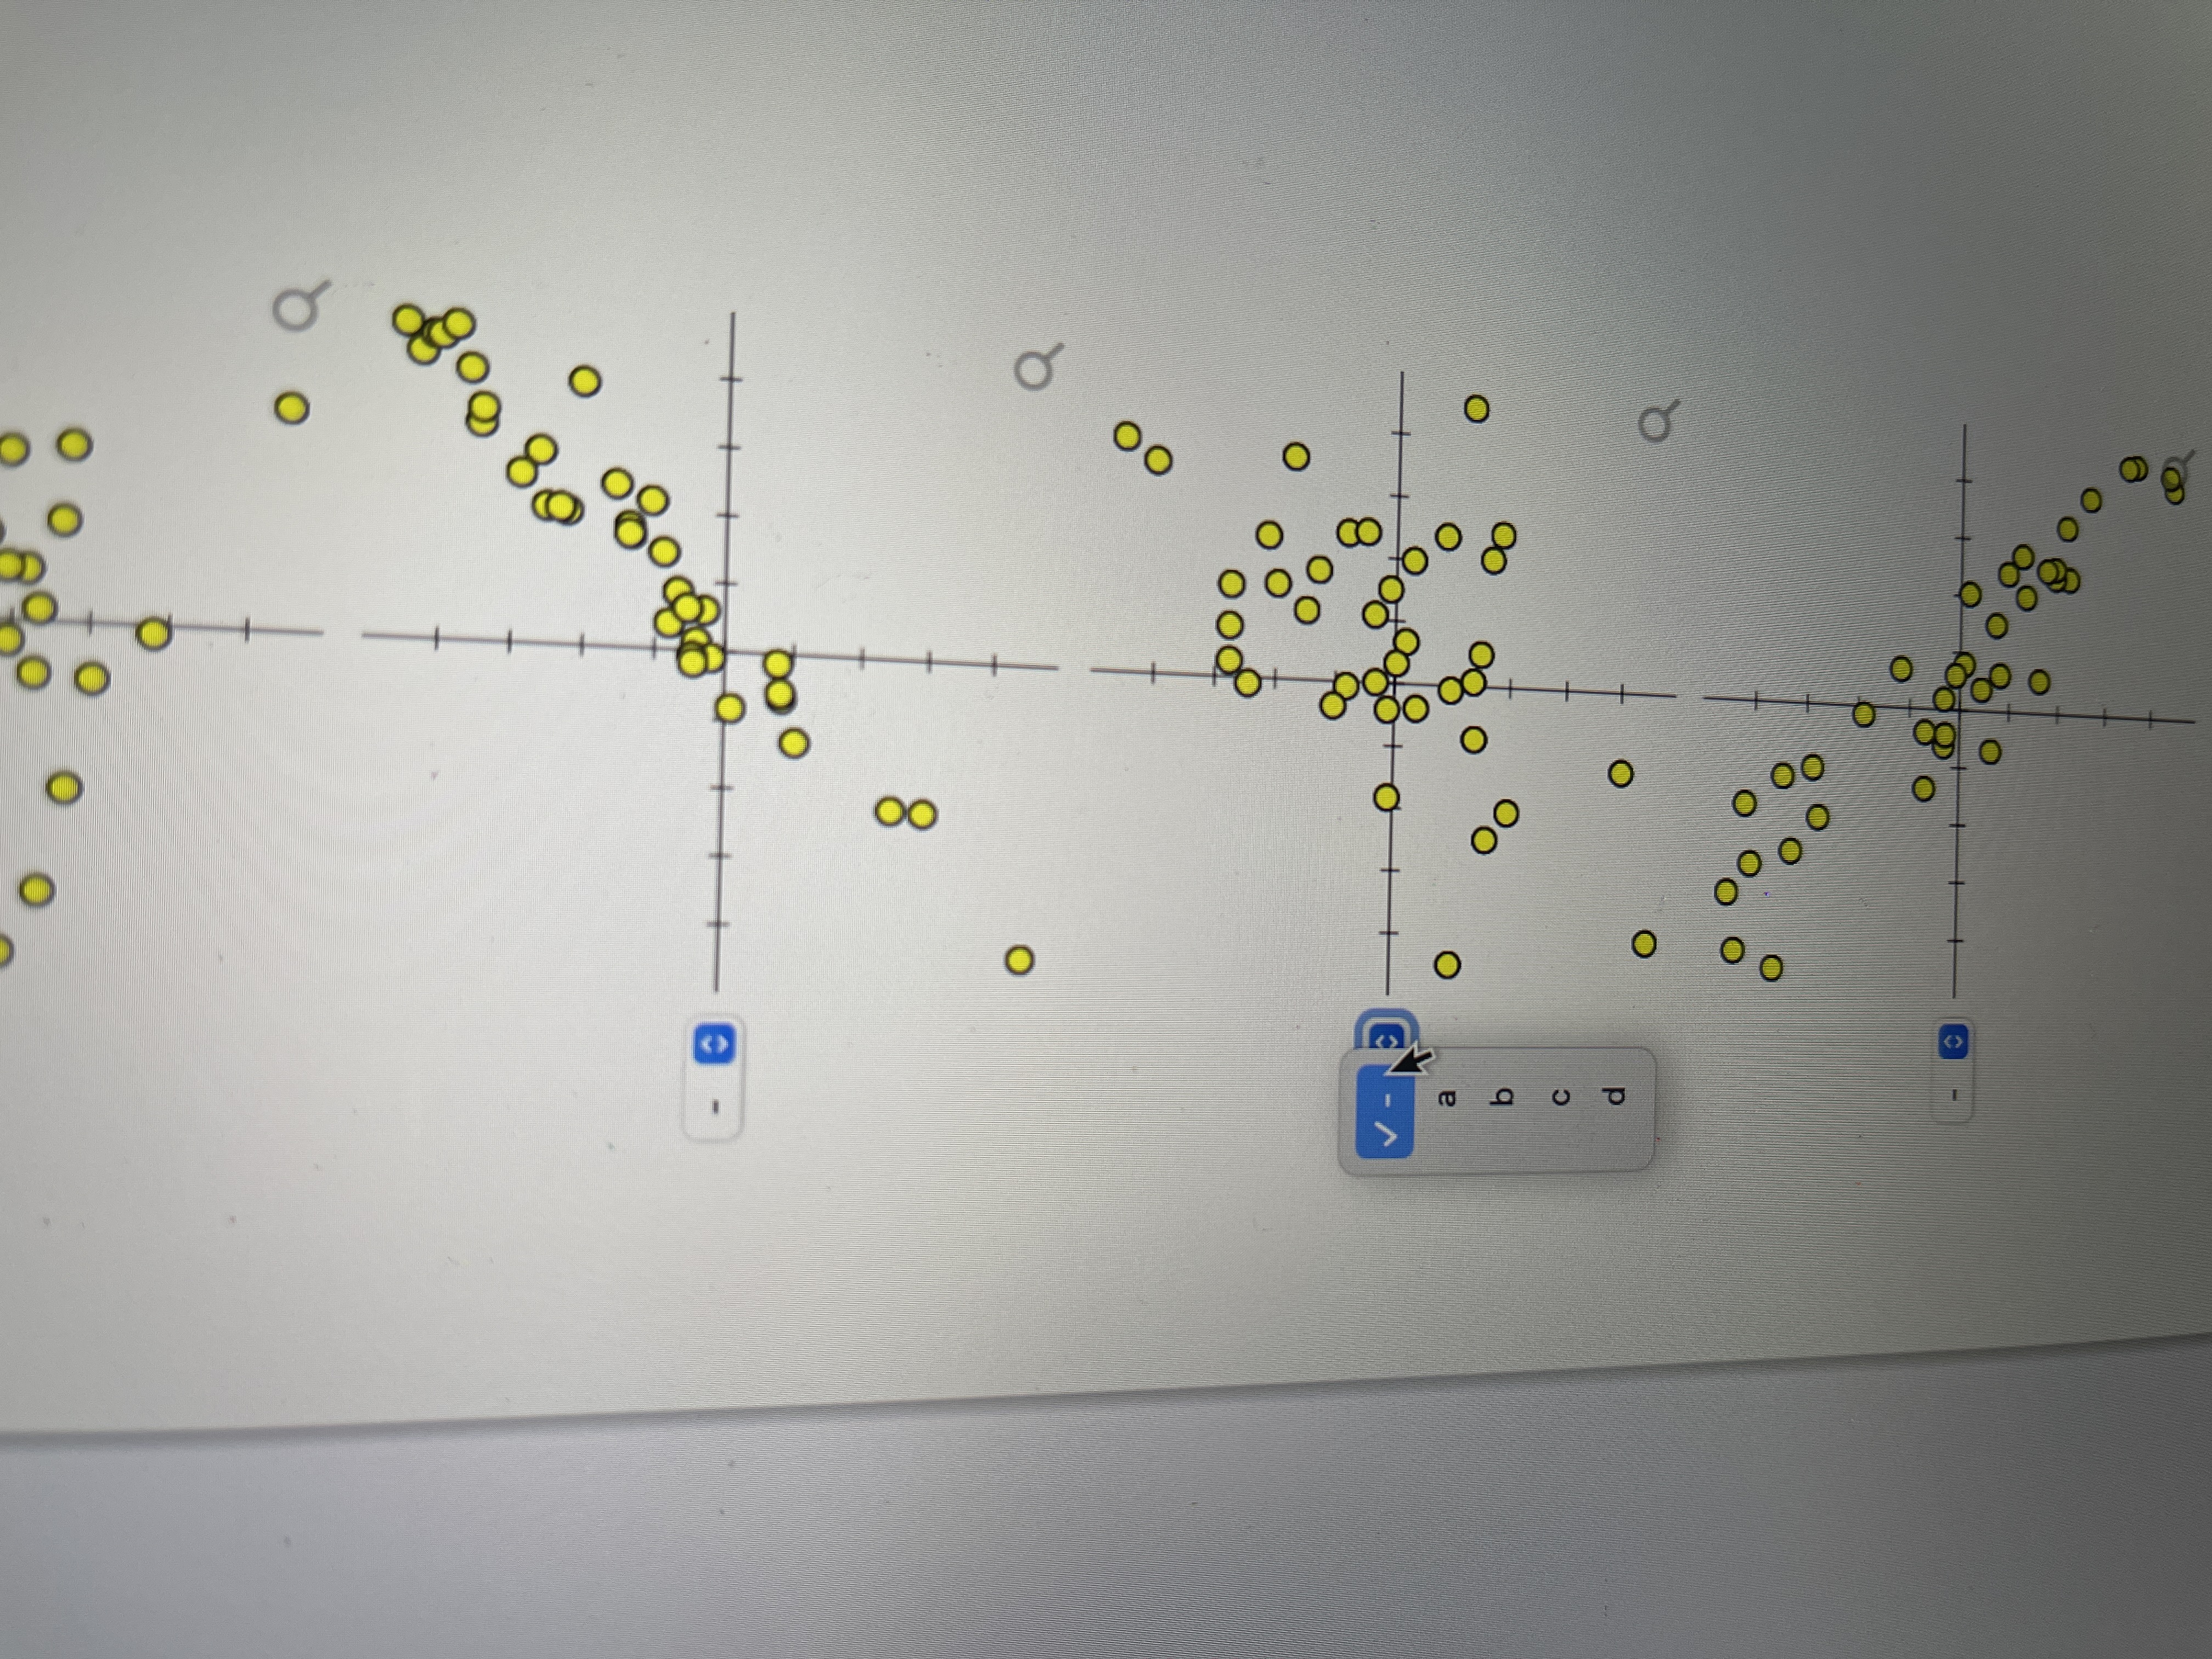


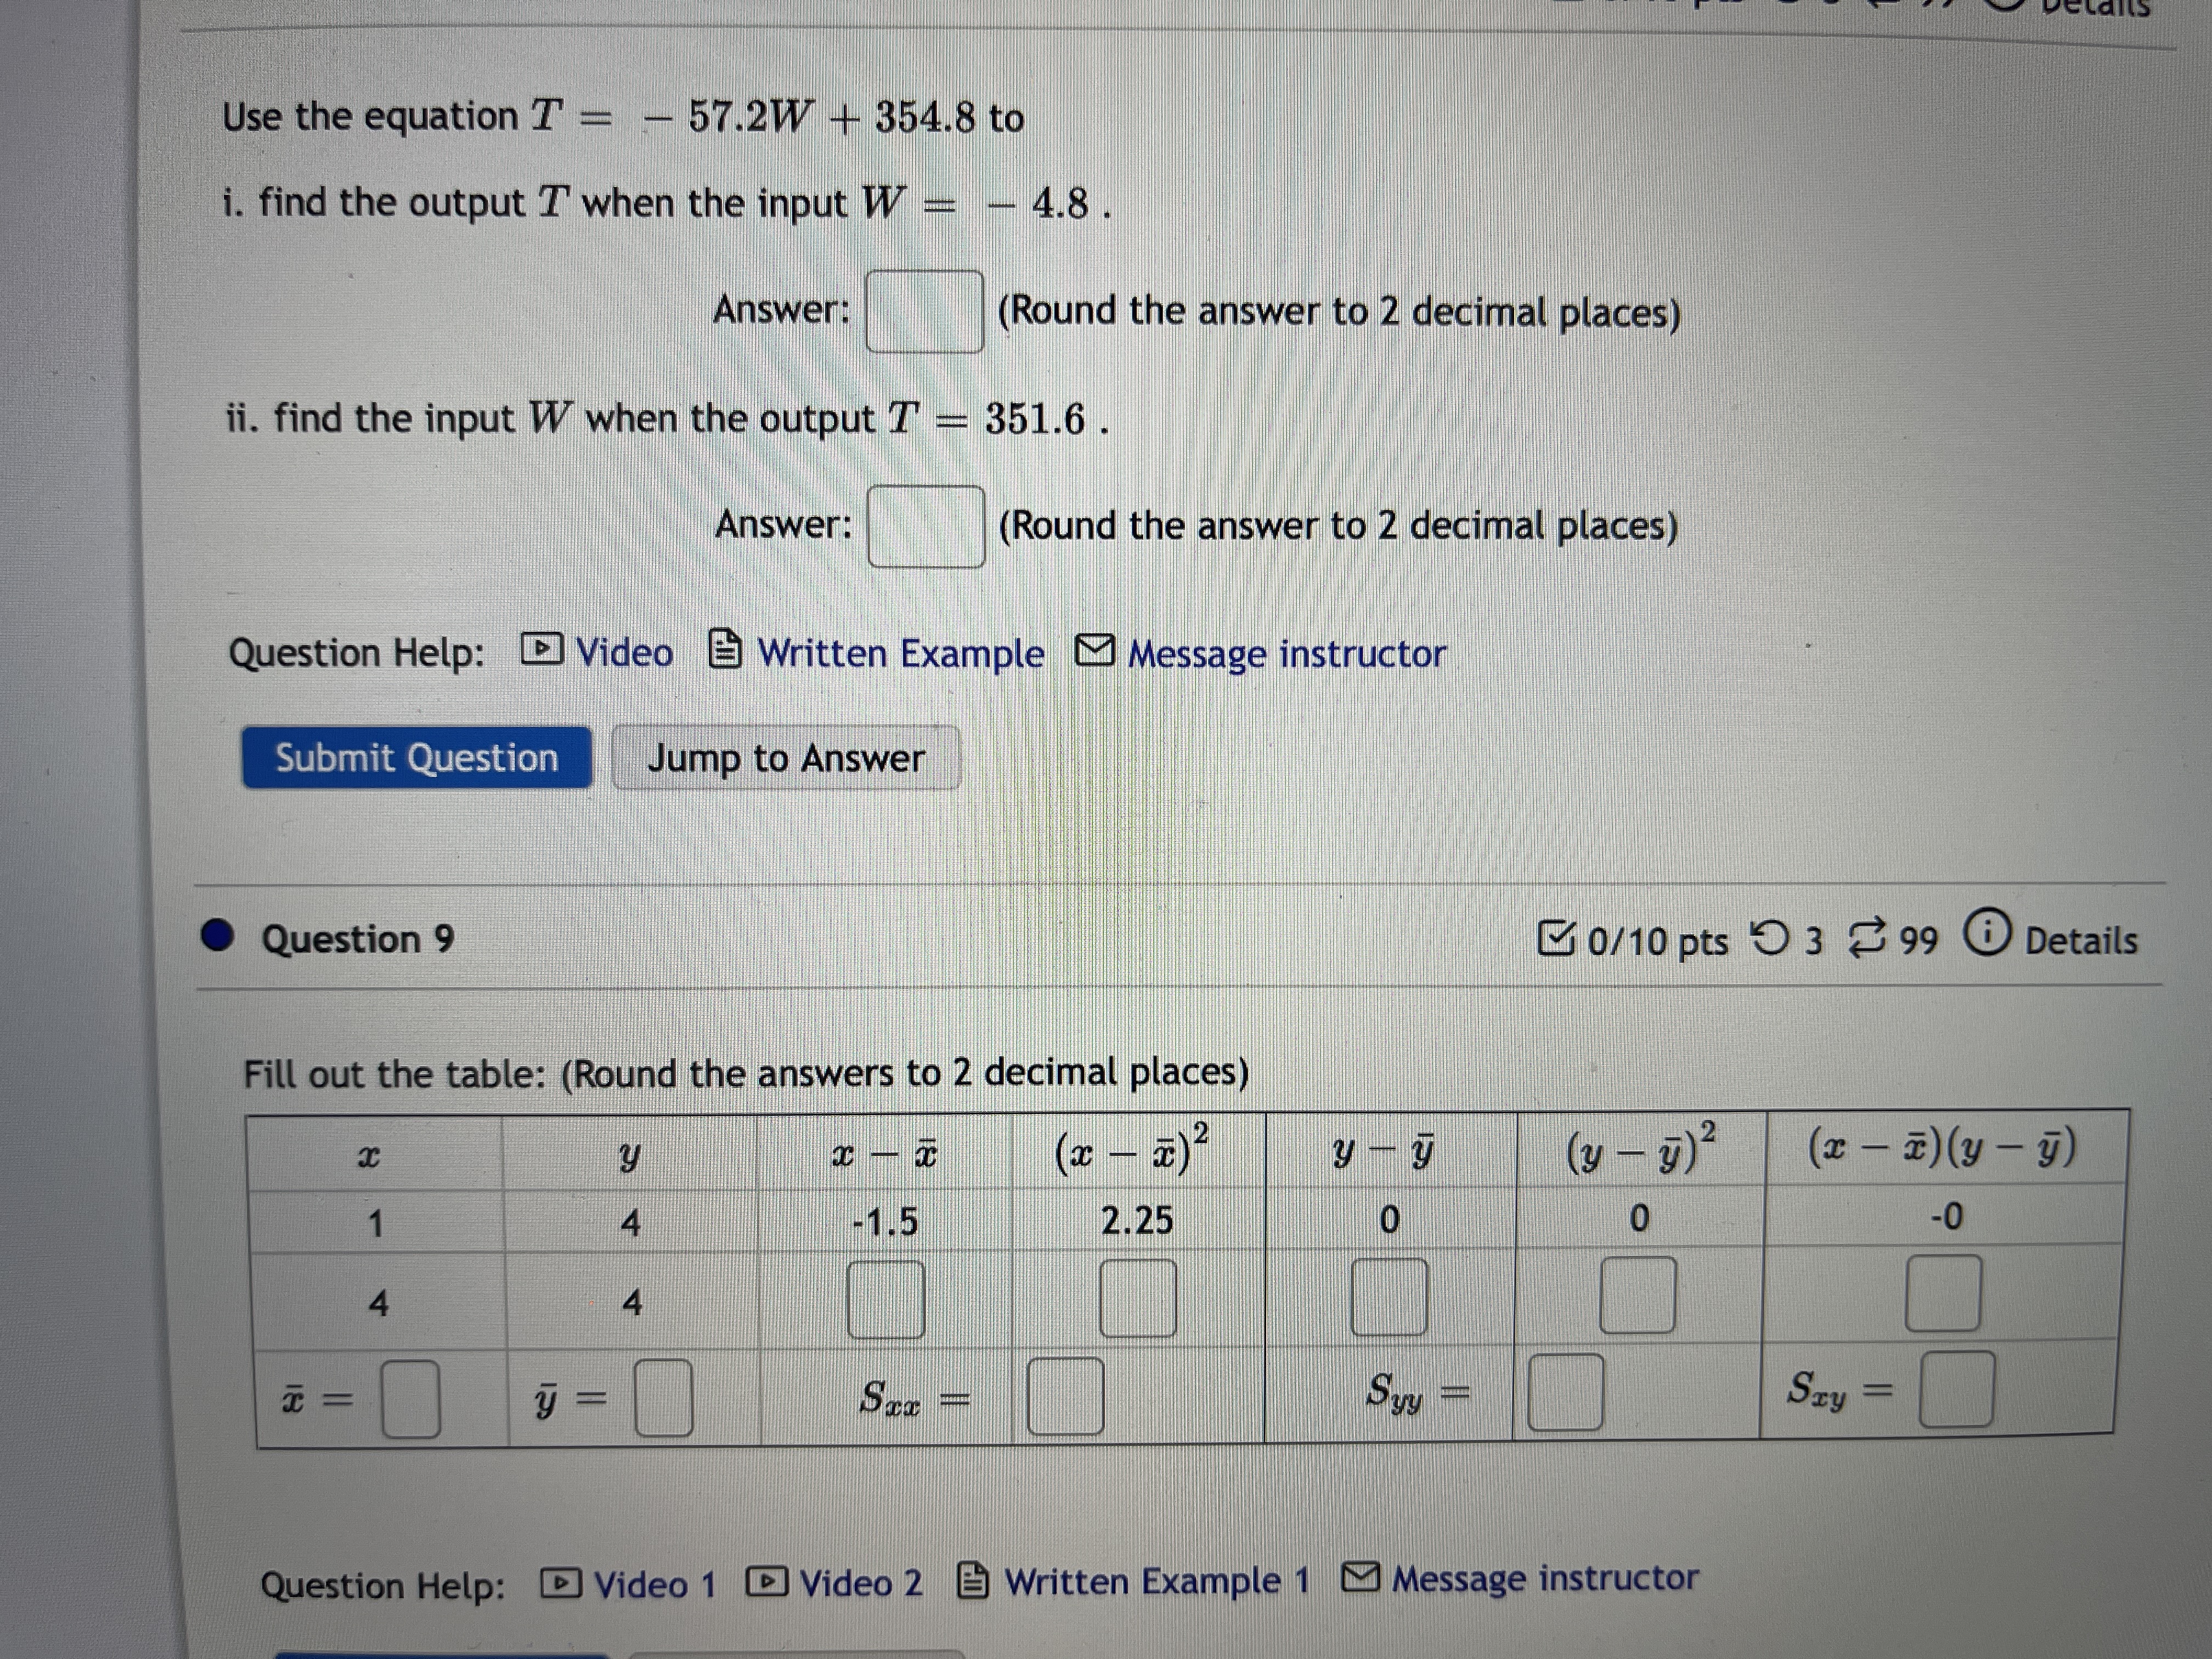
Match each scatterplot shown below with one of the four specified correlations. O a. 0.97 b. 0.51 c. 0.05 O O - E d. -0.93 O O 08008 O - 0 8 O OO O - G O OO O OO O Oo O O O O O4 0/10 pts 3 9 Based on the data shown below, calculate the regression line (each value to two decimal places) y = X 3 7.76 4 11.78 5 14.6 6 12.92 7 16.04 8 20.06 9 21.78 10 23.7 Question Help: Video Message instructor Submit Question Jump to Answer Question 7 0/10 pts 9 3 99 0 Annual high temperatures in a certain location have been tracked for several years. Let X represent the number of years after 2000 and Y the high temperature. Based on the data shown below, calculate the li regression equation using technology (each constant to three decimal places). X y 2 34.1 3 33.45 4 32.2 5 34.15 6 35.5 7 36.95 8 36.9 9 38.05 10 37.2 11 38.35 12 38.5 13 40.25 14 40.6 Question Help: [Video Message instructor Submit Question Jump to Answer Question 8 Go/ 10 pts 9 3 99 @ DetailsUse the equation T = - 57.2W + 354.8 to i. find the output T when the input W = 4.8 . Answer: (Round the answer to 2 decimal places) ii. find the input W when the output T = 351.6 . Answer: (Round the answer to 2 decimal places) Question Help: Video ) Written Example Message instructor Submit Question Jump to Answer . Question 9 0/10 pts 9 3 99 @ Details Fill out the table: (Round the answers to 2 decimal places) y y - y ( y - )2 (x - x) (y-y) A -1.5 2.25 0 0 -0 A 4 T = y = Syy - Say = Question Help: [ Video 1 ) Video 2 ) Written Example 1 Message instructor
Step by Step Solution
There are 3 Steps involved in it

Get step-by-step solutions from verified subject matter experts