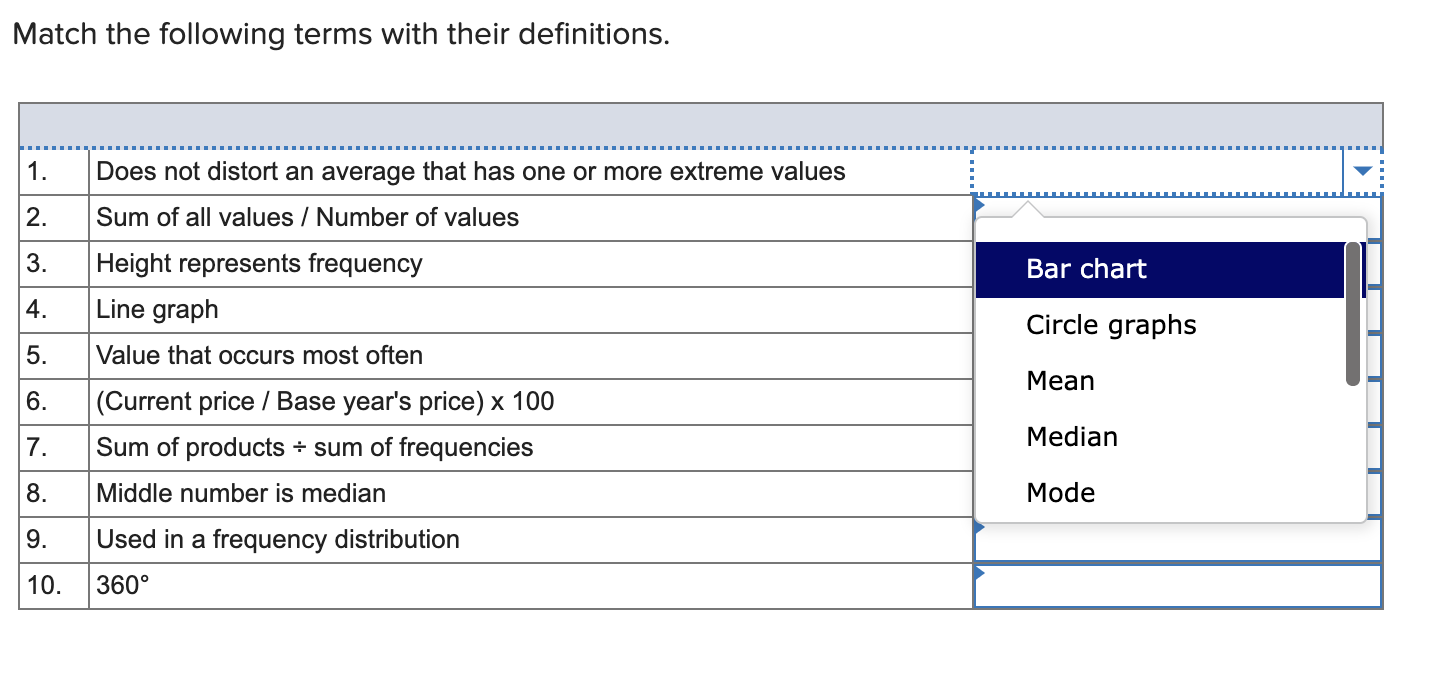
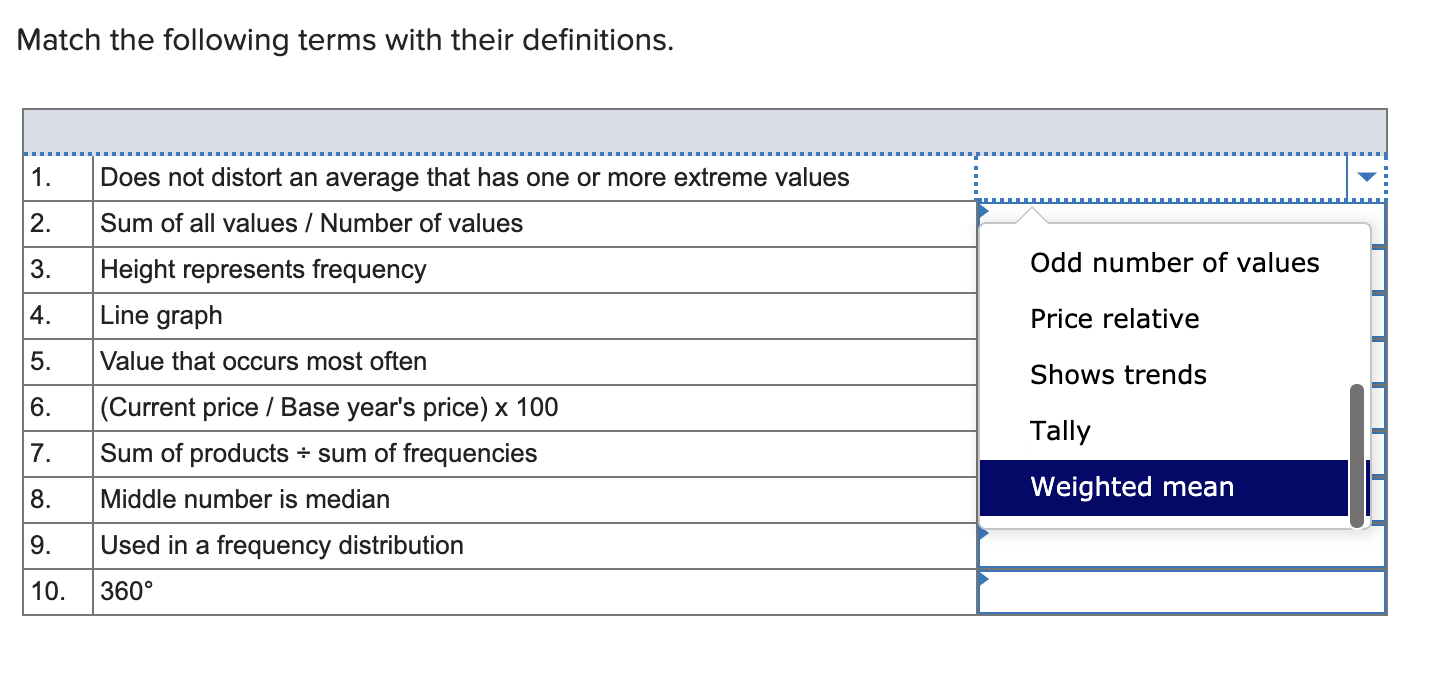
Question: Match the following terms with their definitions. 1. Does not distort an average that has one or more extreme values 2. Sum of all values

Match the following terms with their definitions.Match the following terms with their definitions.

Match the following terms with their definitions. 1. Does not distort an average that has one or more extreme values 2. Sum of all values / Number of values 3. Bar chart Height represents frequency Line graph 4. Circle graphs 5. Value that occurs most often Mean 6. 7. Median 8. (Current price / Base year's price) x 100 Sum of products - sum of frequencies Middle number is median Used in a frequency distribution 360 Mode 9. 10. Match the following terms with their definitions. 1. Does not distort an average that has one or more extreme values 2. Sum of all values / Number of values 3. Odd number of values 4. Price relative 5. Height represents frequency Line graph Value that occurs most often (Current price / Base year's price) x 100 Sum of products - sum of frequencies Middle number is median Shows trends 6. Tally 7. 8. Weighted mean 9. Used in a frequency distribution 10. 360

Step by Step Solution

There are 3 Steps involved in it

1 Expert Approved Answer
Step: 1 Unlock blur-text-image
Question Has Been Solved by an Expert!

Get step-by-step solutions from verified subject matter experts

Step: 2 Unlock
Step: 3 Unlock

Students Have Also Explored These Related General Management Questions!