Question: Match the function with the graph: - -23 - v 24 a. -10-9 -8 - 6 b. . 10 - -6 5 For the polynomial
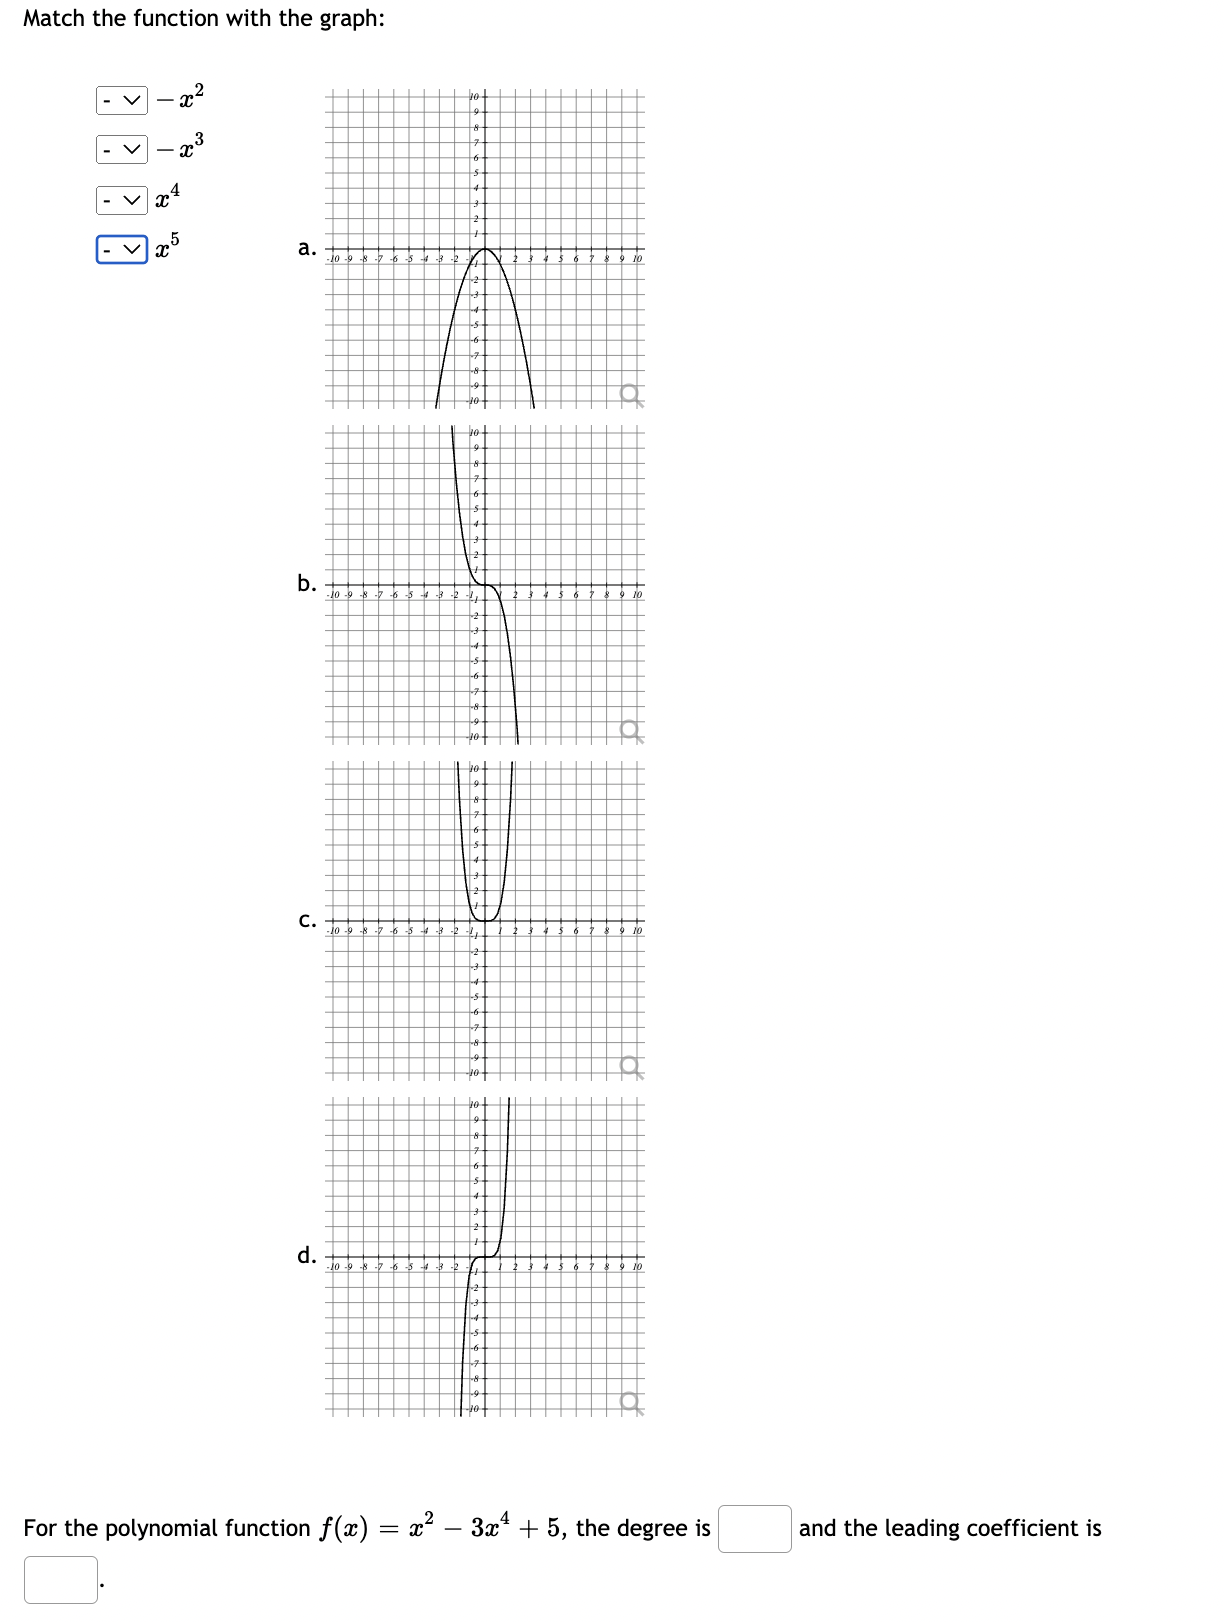
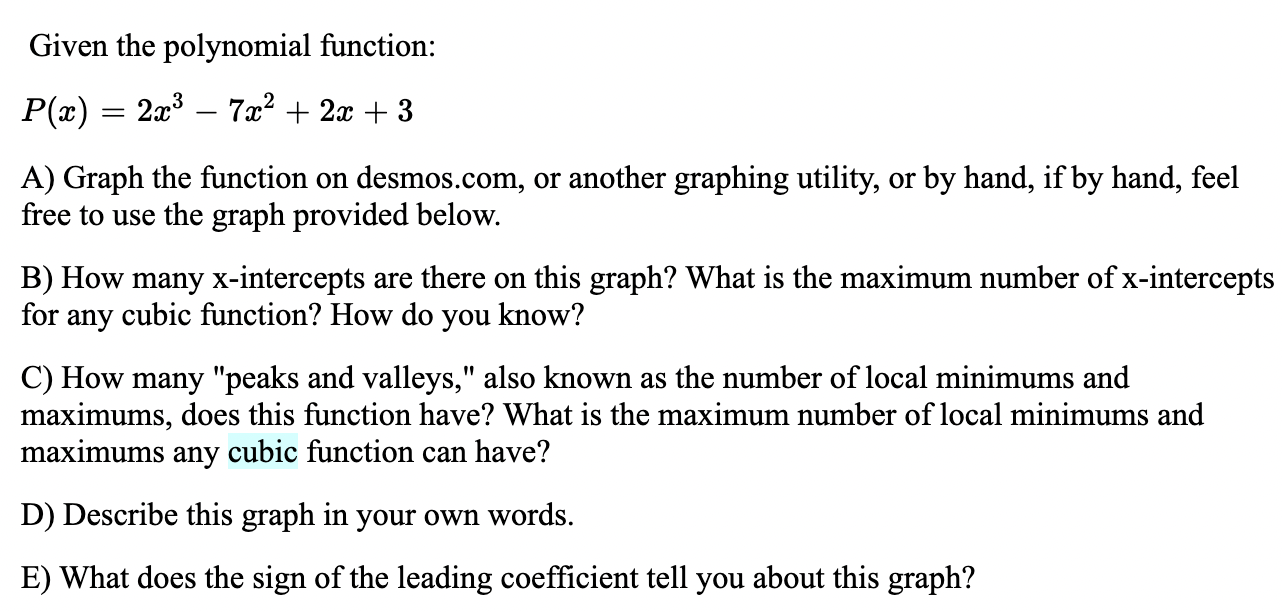
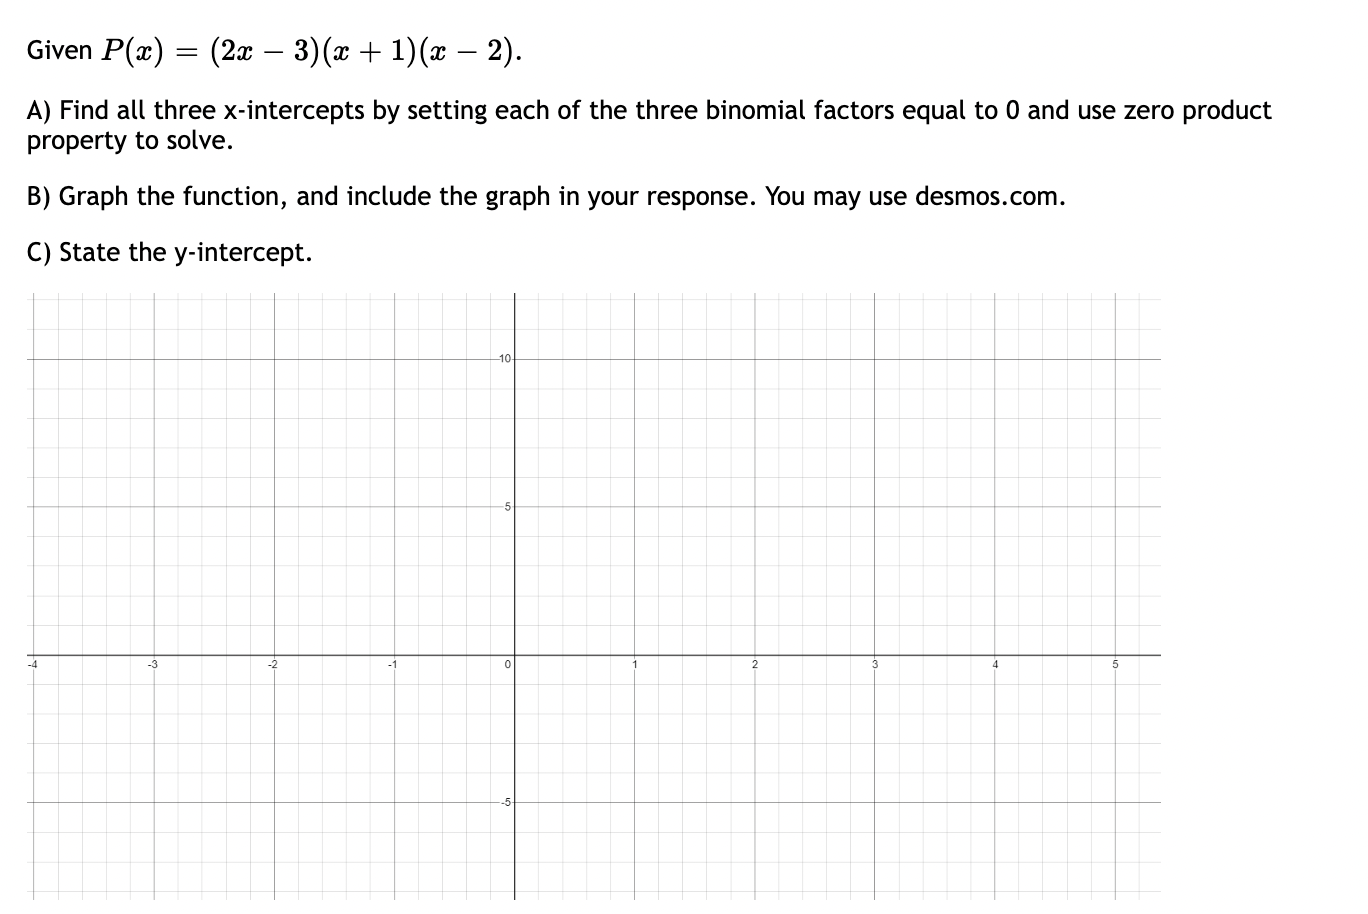
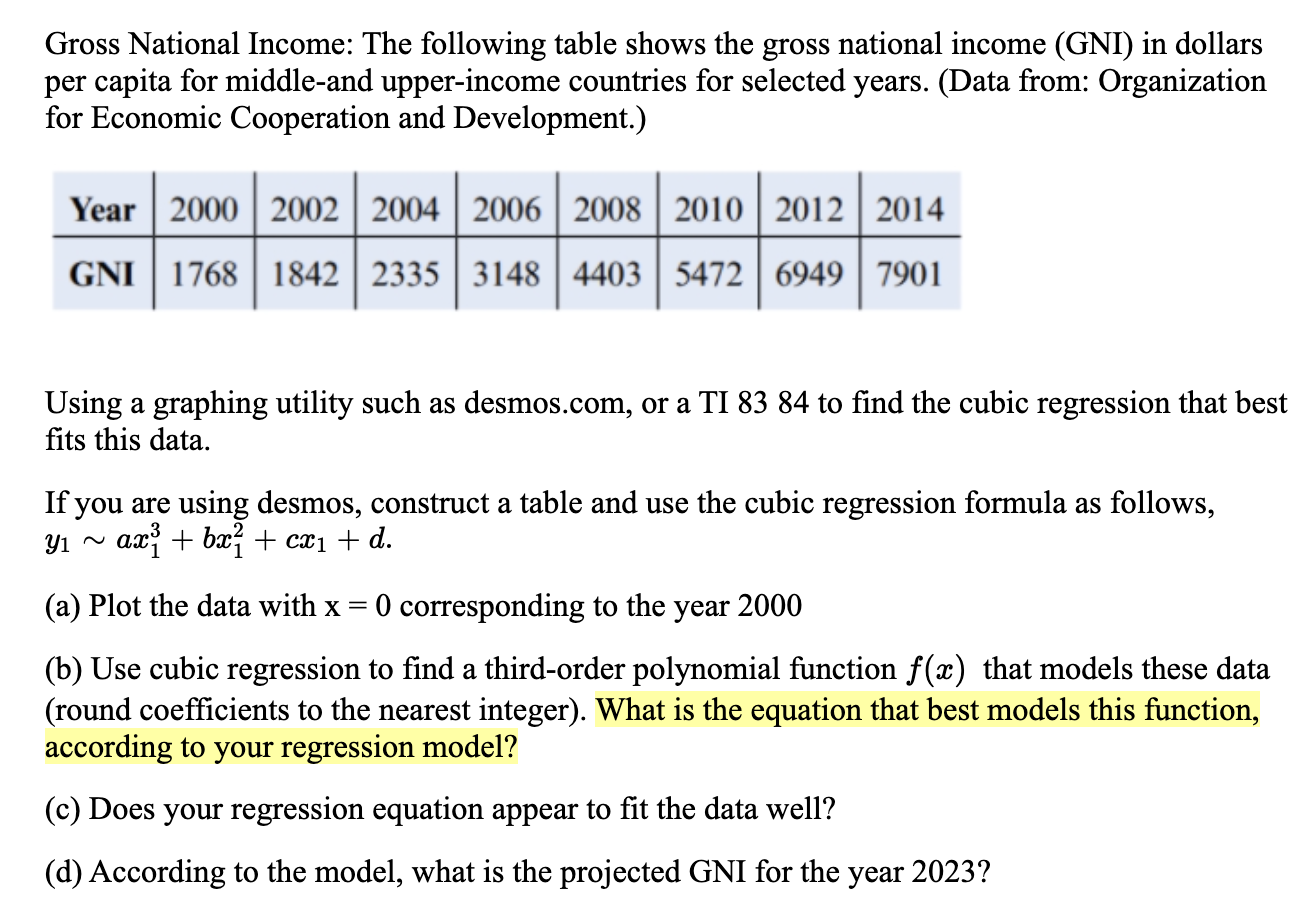
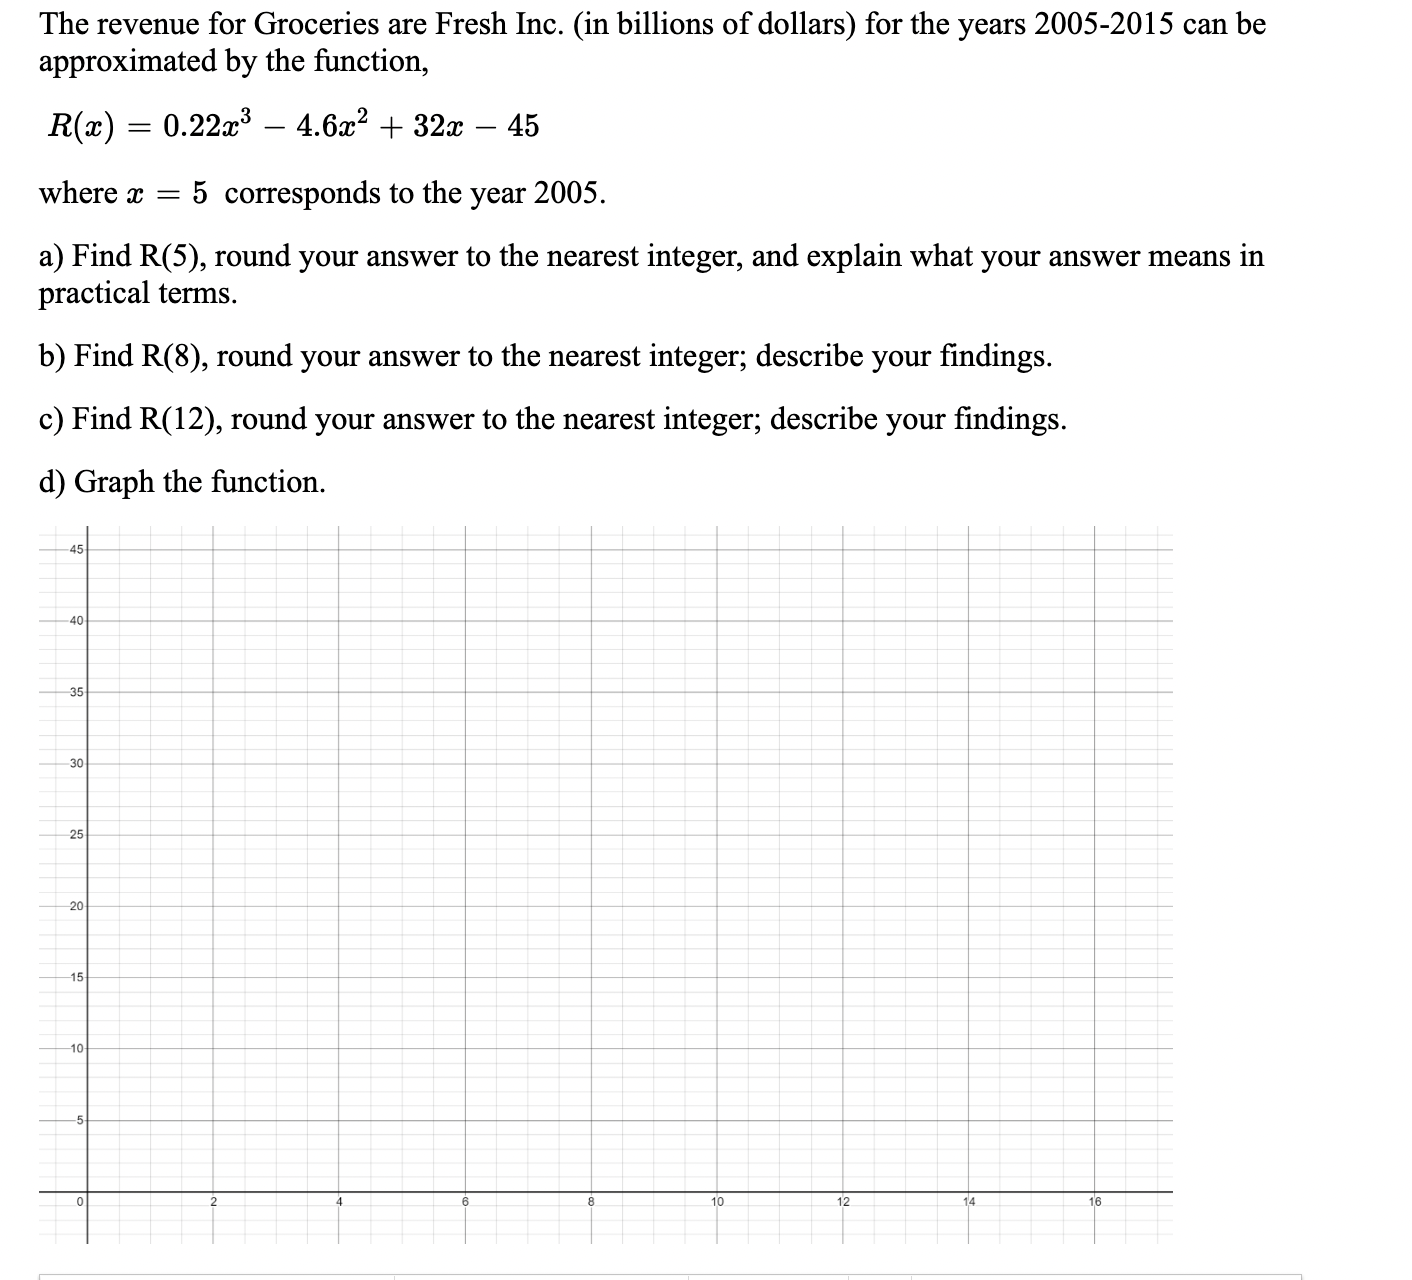
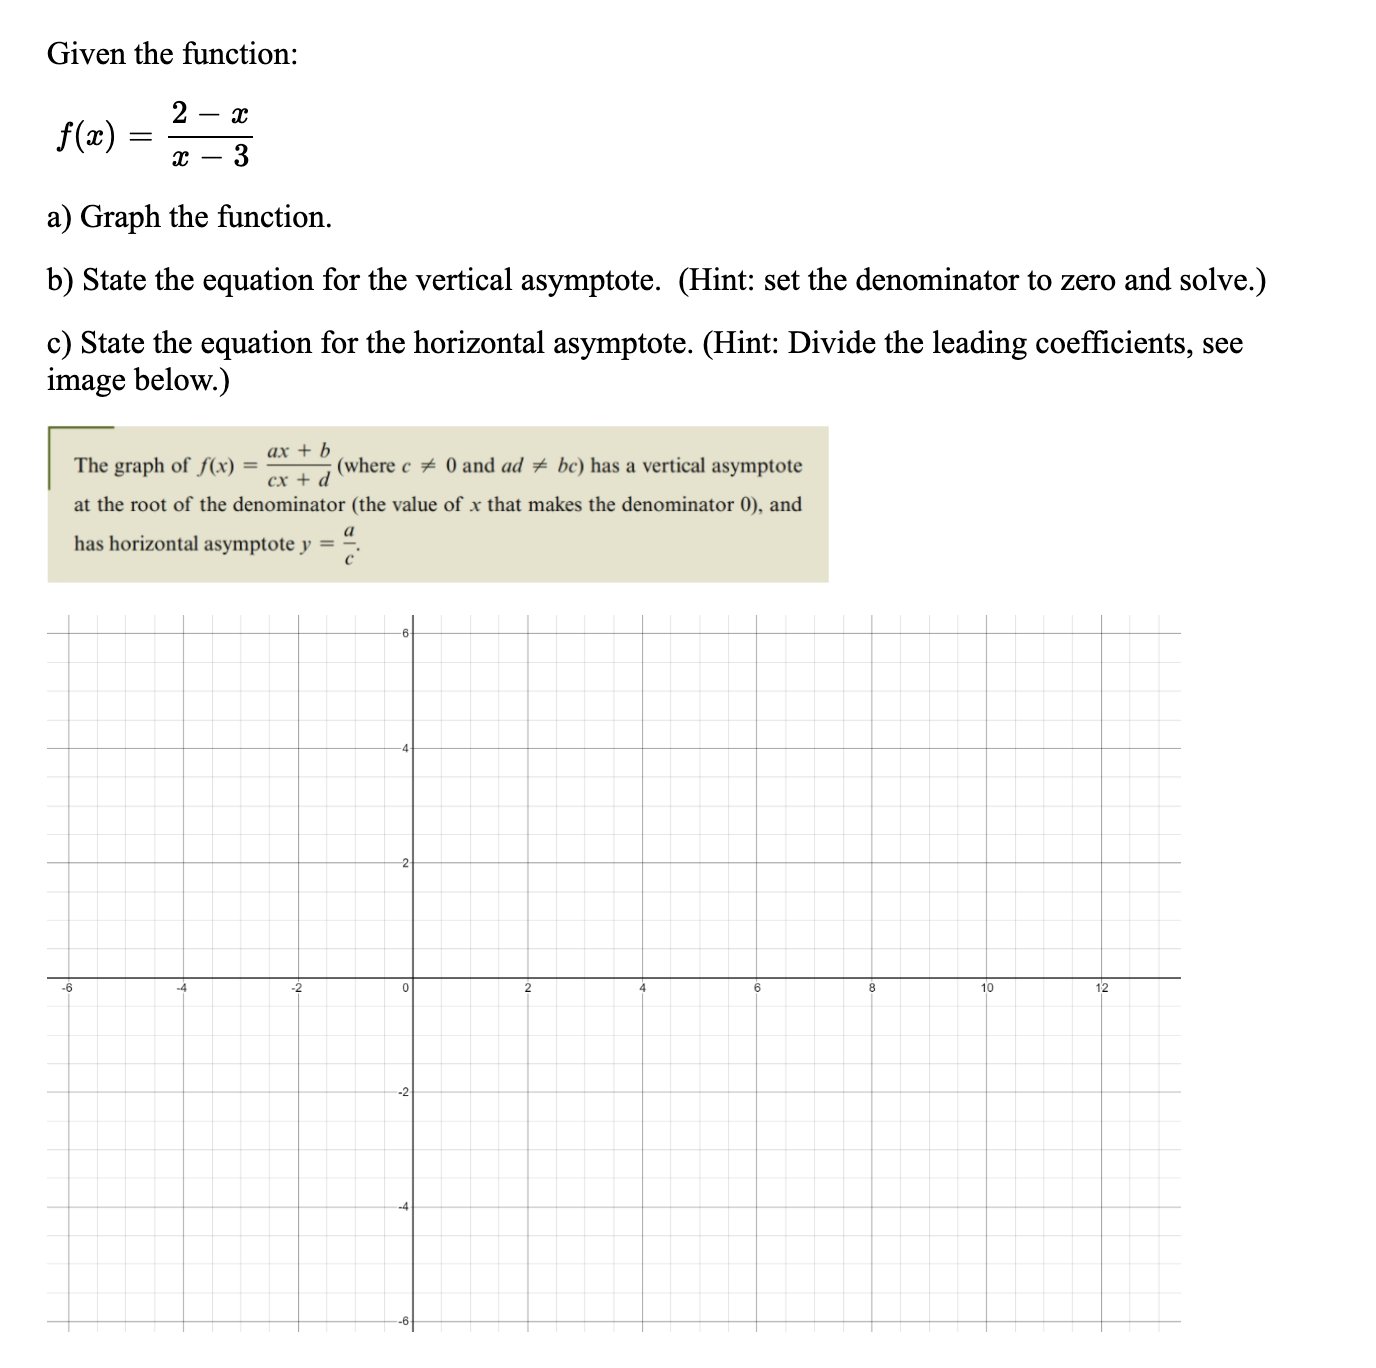
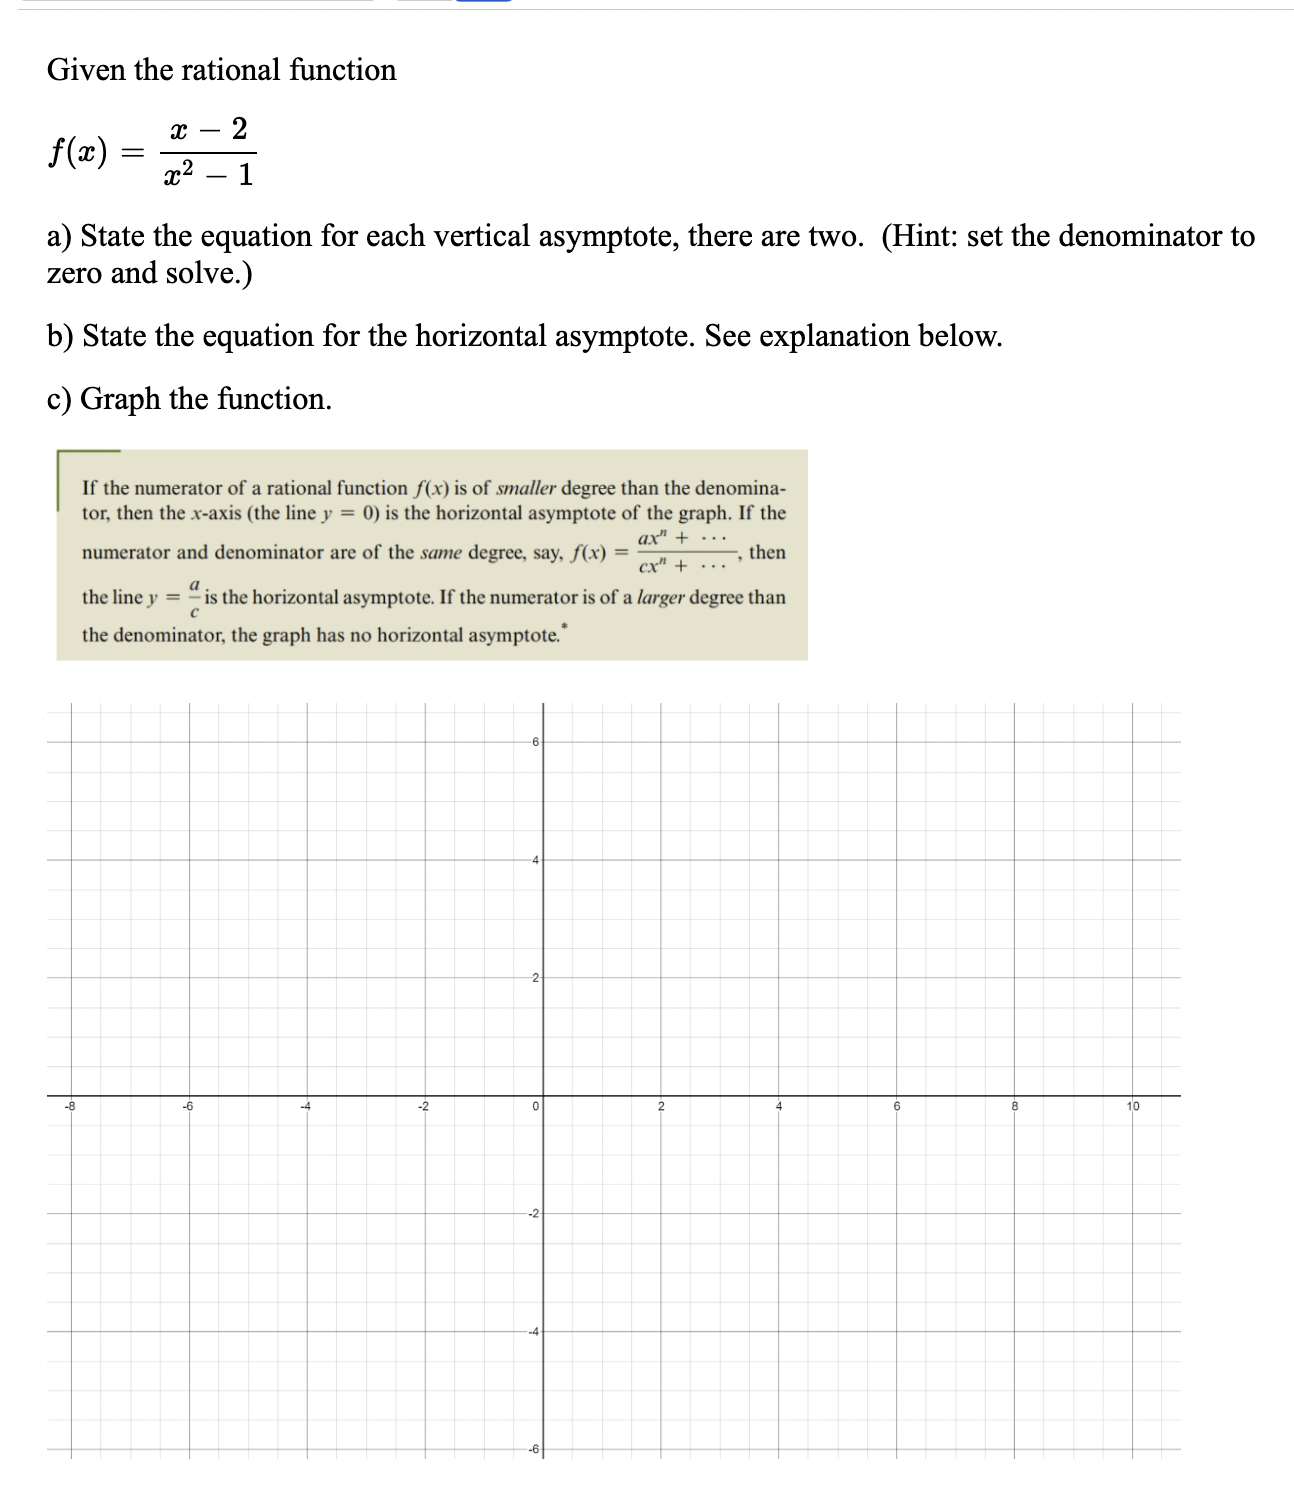
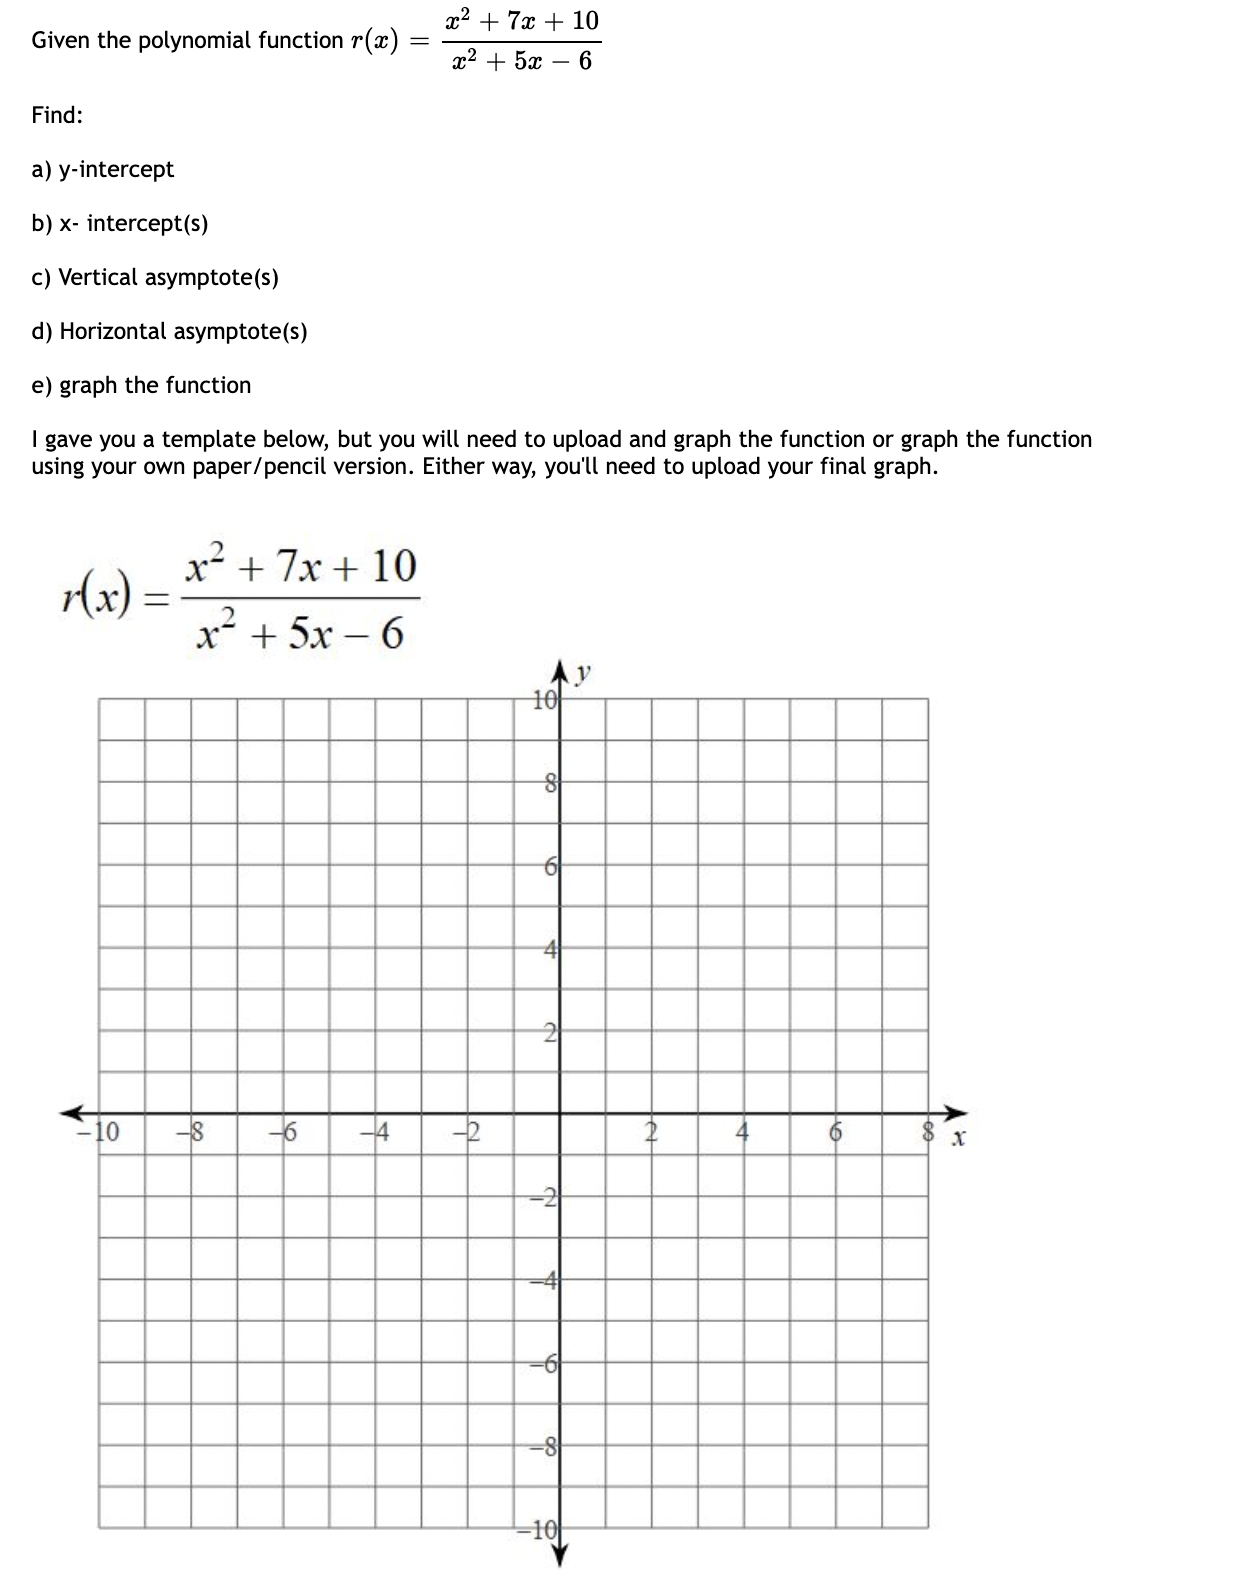
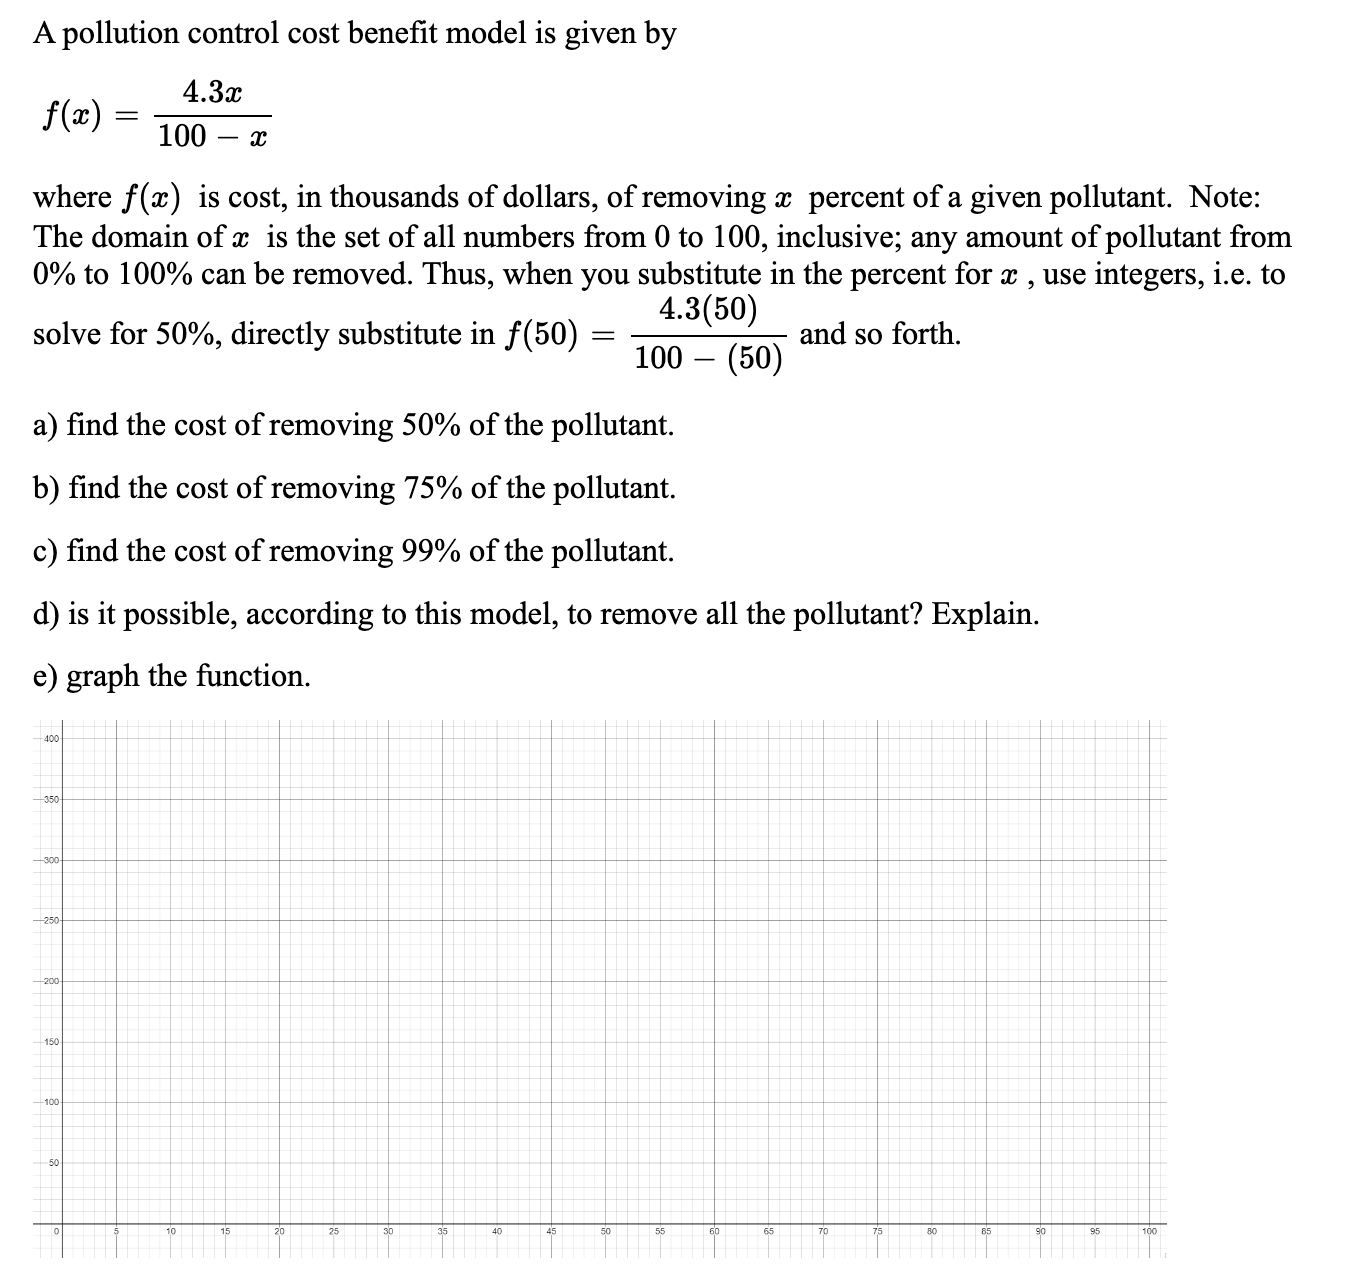
Match the function with the graph: - -23 - v 24 a. -10-9 -8 - 6 b. . 10 - -6 5 For the polynomial function f(a) = a2 - 3x* + 5, the degree is and the leading coefficient isGiven the polynomial function: P(:n) : 23:3 7:32 + 2x + 3 A) Graph the function on desmos.con1, or another graphing utility, or by hand, if by hand, feel free to use the graph provided below. B) How many x-intercepts are there on this graph? What is the maximum number of x-intercepts for any cubic function? How do you know? C) How many "peaks and valleys,\" also known as the number of local minimums and maximums, does this function have? What is the maximum number of local minimums and maximums any cubic function can have? D) Describe this graph in your own words. E) What does the sign of the leading coefcient tell you about this graph? Given P(:I:) = (2:1: 3)(a: + 1)(m 2). A) Find all three x-intercepts by setting each of the three binomial factors equal to 0 and use zero product property to solve. B) Graph the function, and include the graph in your response. You may use desmos.com. C) State the y-intercept. 1C Gross National Income: The following table shows the gross national income (GNI) in dollars per capita for middle-and upper-income countries for selected years. (Data from: Organization for Economic Cooperation and Development.) Using a graphing utility such as desmos.com, or a TI 83 84 to nd the cubic regression that best ts this data. If you are using desmos, construct a table and use the cubic regression formula as follows, :01 N a3}? + 53:? + 6:81 + d. (a) Plot the data with x : 0 corresponding to the year 2000 (b) Use cubic regression to nd a third-order polynomial function f (:13) that models these data (round coefcients to the nearest integer). What is the equation that best models this mction, according to your regression model? (0) Does your regression equation appear to t the data well? (d) According to the model, What is the projected GNI for the year 2023? The revenue for Groceries are Fresh Inc. (in billions of dollars) for the years 2005-2015 can be approximated by the function, 3(3) 2 0.22523 F 4.69:2 + 323: ~ 45 where a: : 5 corresponds to the year 2005. a) Find R(5), round your answer to the nearest integer, and explain what your answer means in practical terms. b) Find R(8), round your answer to the nearest integer; describe your ndings. 0) Find R(12), round your answer to the nearest integer; describe your ndings. (1) Graph the function. 45 40 25 20 15 10 Given the function: f (ac) = . ac 3 a) Graph the function. b) State the equation for the vertical asymptote. (Hint: set the denominator to zero and solve.) c) State the equation for the horizontal asymptote. (Hint: Divide the leading coefficients, see image below.) The graph of f(x) = ax + b ex + d (where c # 0 and ad # bc) has a vertical asymptote at the root of the denominator (the value of x that makes the denominator 0), and has horizontal asymptote y = - 10 12Given the rational inction m2 3321 x) : a) State the equation for each vertical asymptote, there are two. (Hint: set the denominator to zero and solve.) b) State the equation for the horizontal asymptote. See explanation below. 0) Graph the function. [f the numerator of a rational function f(x) is of smaller degree than the denomina- t0r. then the .t-axis (the liner = 0) is the herizontal asymptote of the graph. If the . or" + - - numerator and denominator are of the same degree. say. ft.\\'] = T then m- . . . . a . . . the line y = its the horizontal asymptote. If the numerator is of a larger degree than t the denominator. the graph has no horizontal asymptote, Given the polynomial function x) = $ Find: a) y-intercept b) x- intercept(s) c) Vertical asymptote(s) d) Horizontal asymptote(s) e) graph the function I gave you a template below, but you will need to upload and graph the function or graph the function using your own paper/pencil version. Either way, you'll need to upload your final graph. x2+7x+10 x =., A) x'+5x6 i i h. . A pollution control cost benefit model is given by 4.3x f(a) = 100 - x where f(x) is cost, in thousands of dollars, of removing a percent of a given pollutant. Note: The domain of x is the set of all numbers from 0 to 100, inclusive; any amount of pollutant from 0% to 100% can be removed. Thus, when you substitute in the percent for x , use integers, i.e. to 4.3(50) solve for 50%, directly substitute in f (50) = and so forth. 100 - (50) a) find the cost of removing 50% of the pollutant. b) find the cost of removing 75% of the pollutant. c) find the cost of removing 99% of the pollutant. d) is it possible, according to this model, to remove all the pollutant? Explain. e) graph the function. -350 -300 250 -200 150 100 50
Step by Step Solution
There are 3 Steps involved in it
1 Expert Approved Answer
Step: 1 Unlock
Question Has Been Solved by an Expert!
Get step-by-step solutions from verified subject matter experts
Step: 2 Unlock
Step: 3 Unlock
Students Have Also Explored These Related Mathematics Questions!