

Question: Match the plot with a possible description of the sample. Choose the correct answer below. 0A. 0 B. 0c. 0 D. Grade point averages of
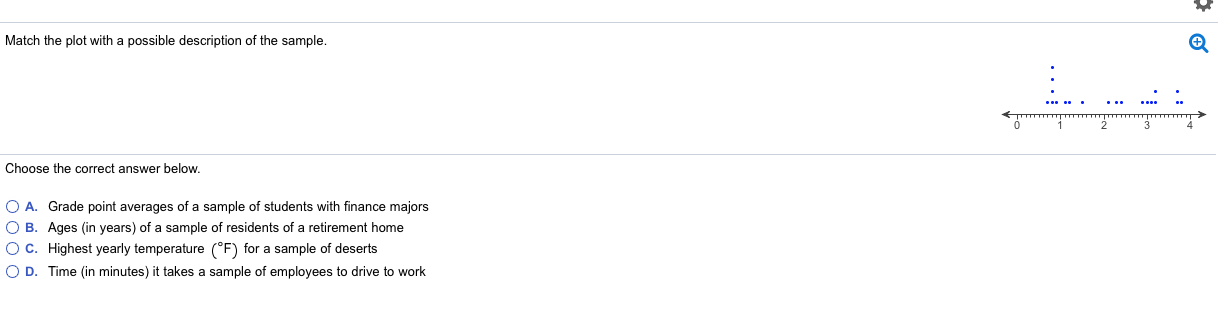
Match the plot with a possible description of the sample. Choose the correct answer below. 0A. 0 B. 0c. 0 D. Grade point averages of a sample of students wilh nance majors Ages (in years) of a sample of residents of a retirement home Highesi yearly temperature (\"F) for a sample efdeserts Time (in minutes) it takes a sample of employees lo drive to work
Step by Step Solution
There are 3 Steps involved in it
1 Expert Approved Answer
Step: 1 Unlock

Question Has Been Solved by an Expert!
Get step-by-step solutions from verified subject matter experts
Step: 2 Unlock
Step: 3 Unlock