

Question: Match the three dimensional graph to the corresponding contour plot. [Contour plots: lighter shades - greater function values.] 0 b) d) Previous | Next a
![plots: lighter shades - greater function values.] 0 b) d) Previous |](https://s3.amazonaws.com/si.experts.images/answers/2024/06/666699f1d6838_113666699f1b6533.jpg)
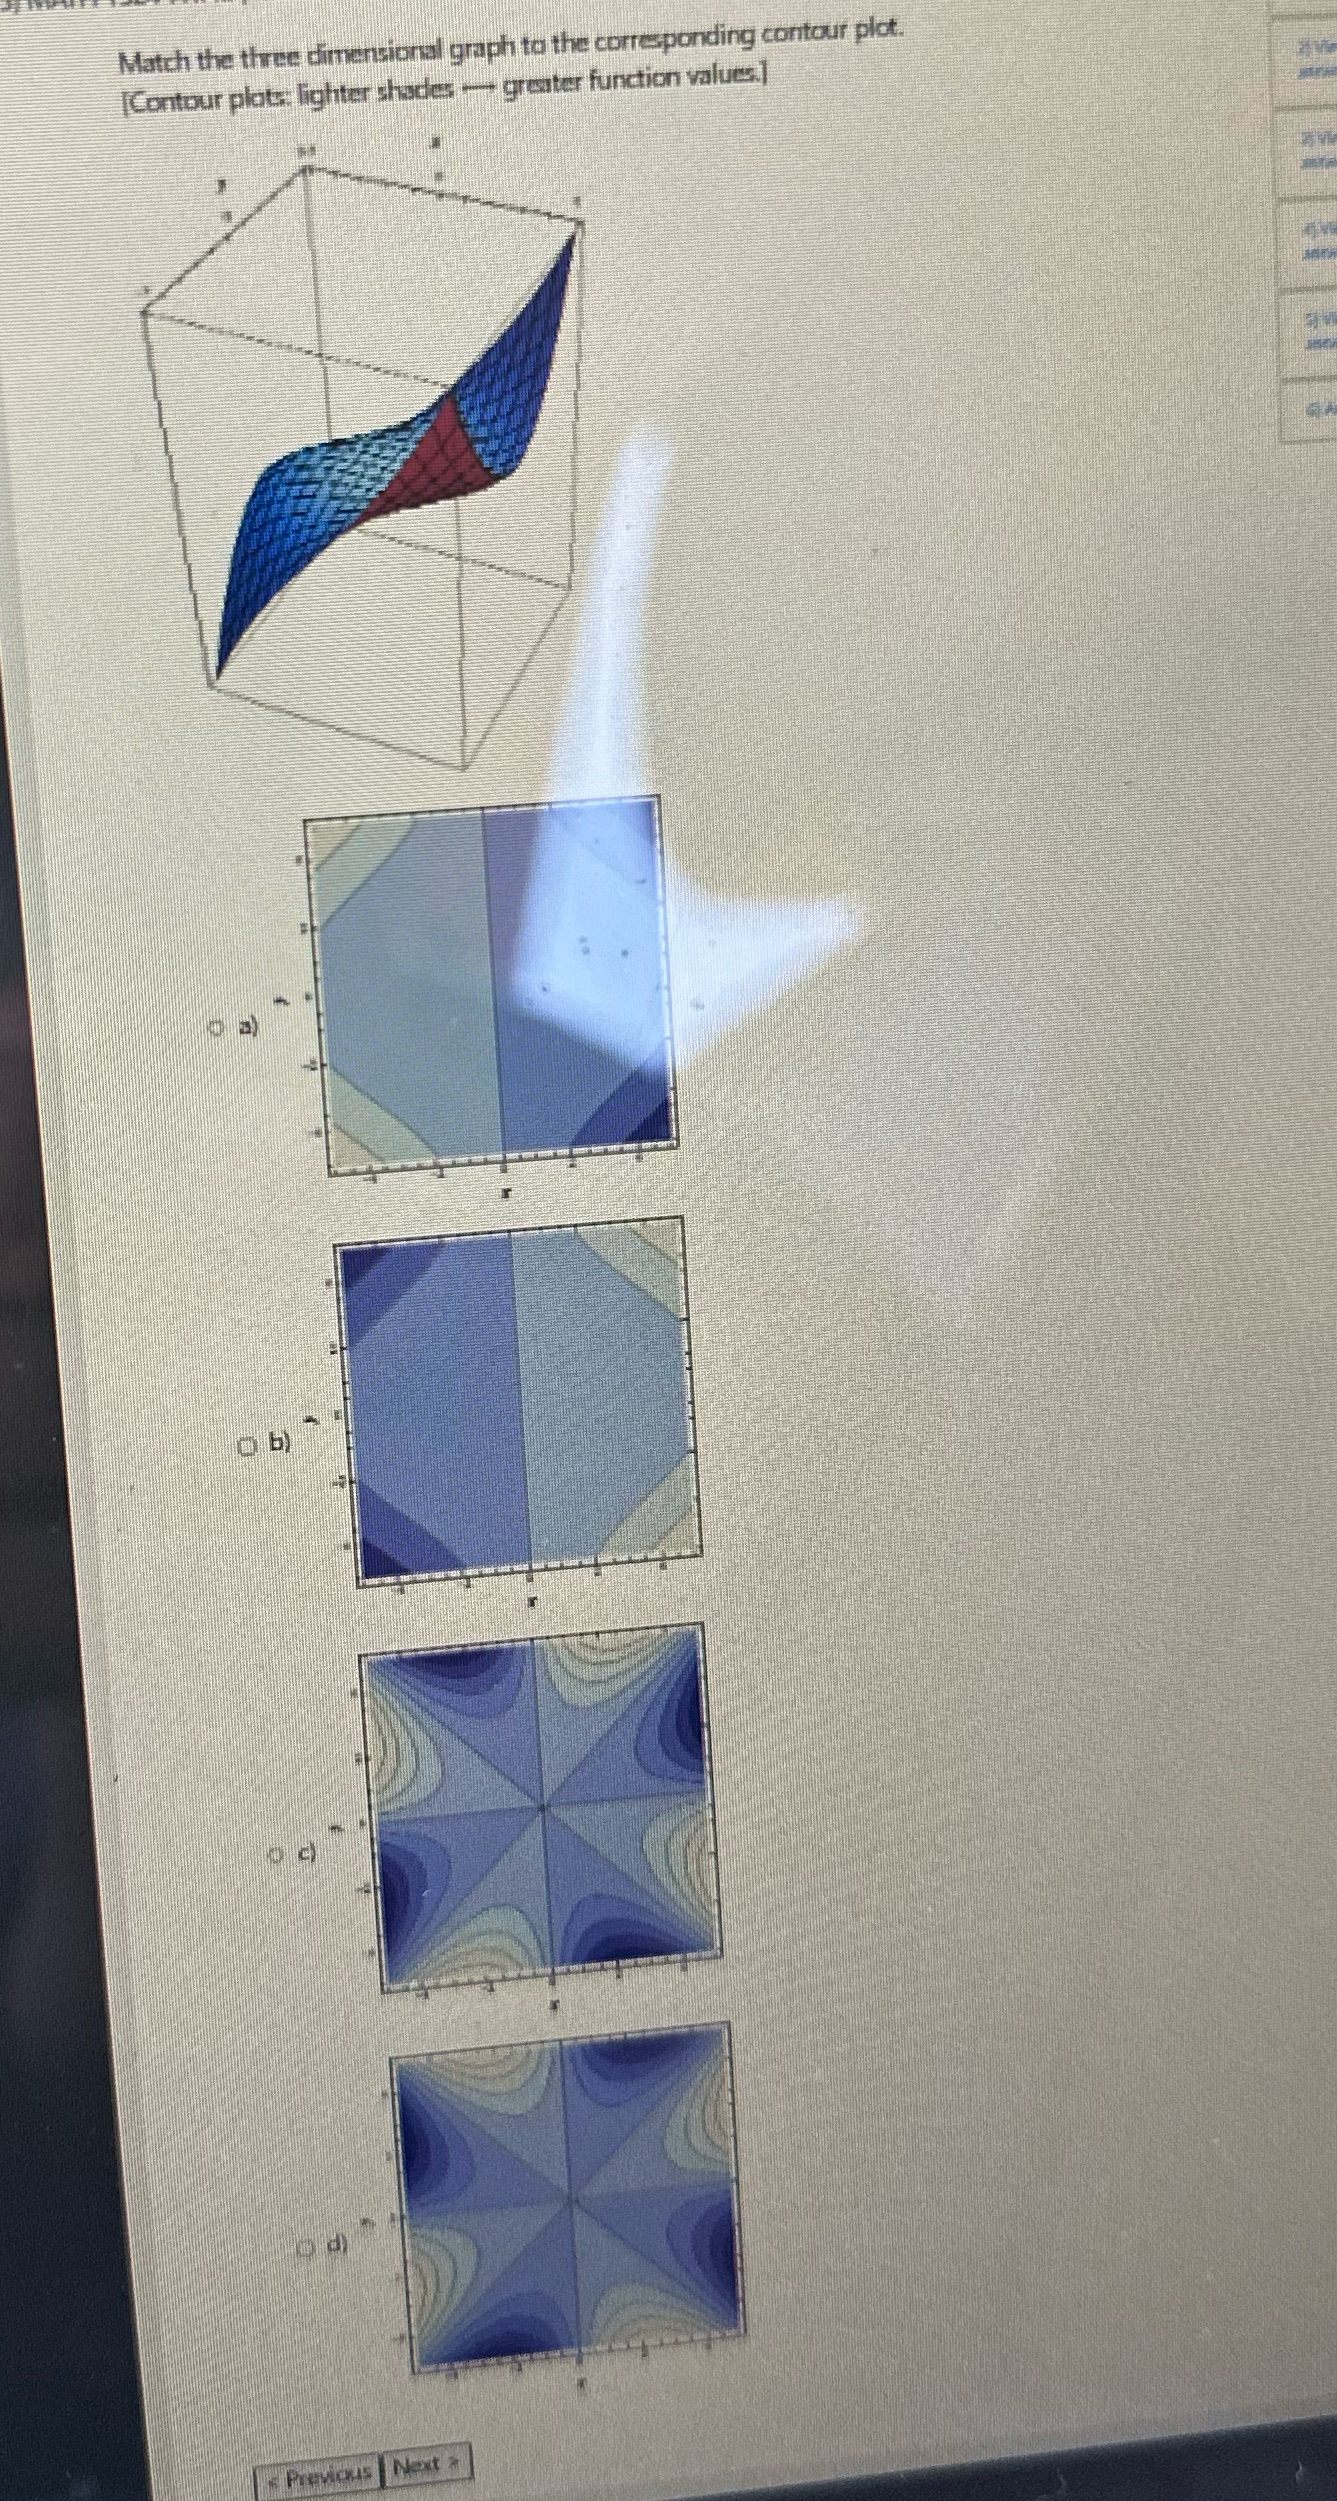
Match the three dimensional graph to the corresponding contour plot. [Contour plots: lighter shades - greater function values.] 0 b) d) Previous | Next a
Step by Step Solution
There are 3 Steps involved in it
1 Expert Approved Answer
Step: 1 Unlock

Question Has Been Solved by an Expert!
Get step-by-step solutions from verified subject matter experts
Step: 2 Unlock
Step: 3 Unlock