

Question: Matching exercise The Legend Identifies which data series each color on the chart represents Vertical Axis 111 The Y-Axis that measures the value of the
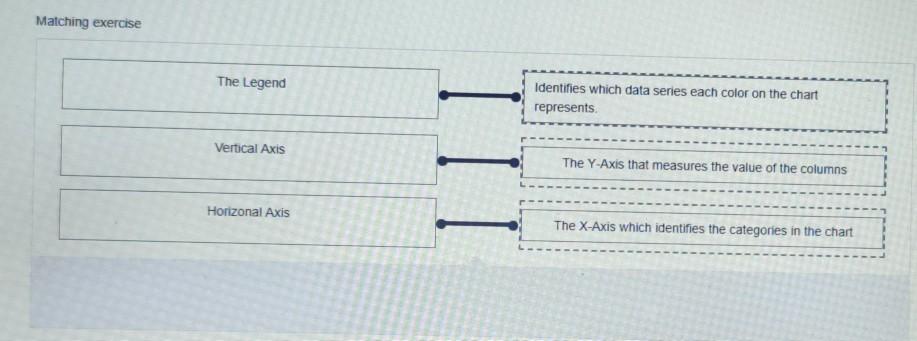
Matching exercise The Legend Identifies which data series each color on the chart represents Vertical Axis 111 The Y-Axis that measures the value of the columns Horizonal Axis The X-Axis which identifies the categories in the chart
Step by Step Solution
There are 3 Steps involved in it
1 Expert Approved Answer
Step: 1 Unlock

Question Has Been Solved by an Expert!
Get step-by-step solutions from verified subject matter experts
Step: 2 Unlock
Step: 3 Unlock