

Matchless Athletics Financial Statements Market Sales and financial Statements (Income Statement and Balance Sheet for Matchless...
Fantastic news! We've Found the answer you've been seeking!
Question:
Transcribed Image Text:
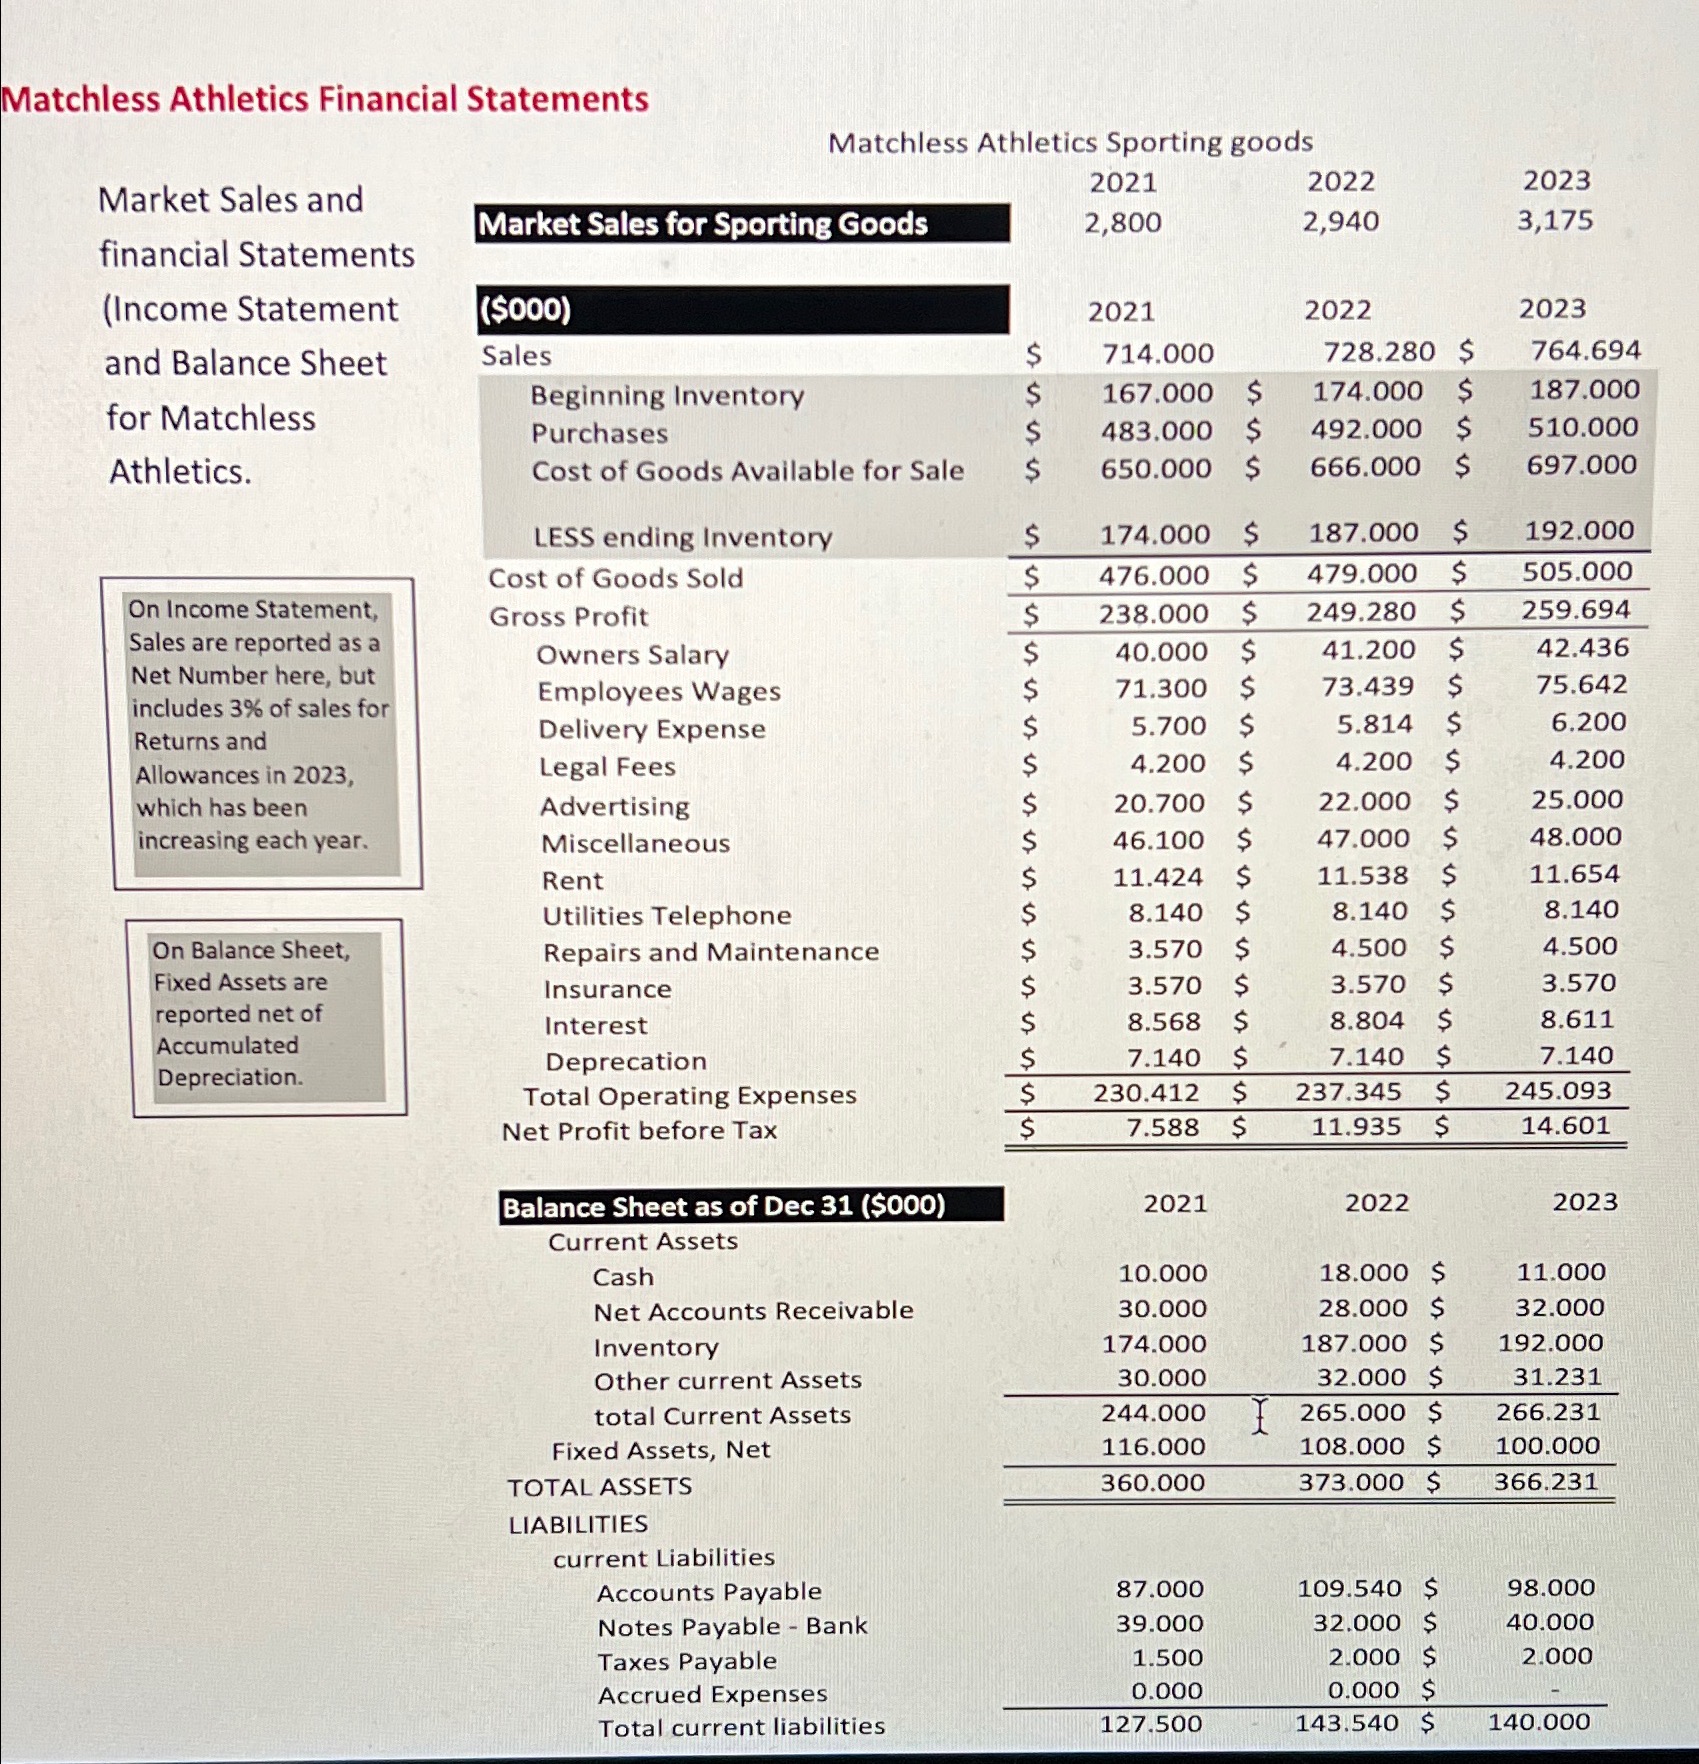
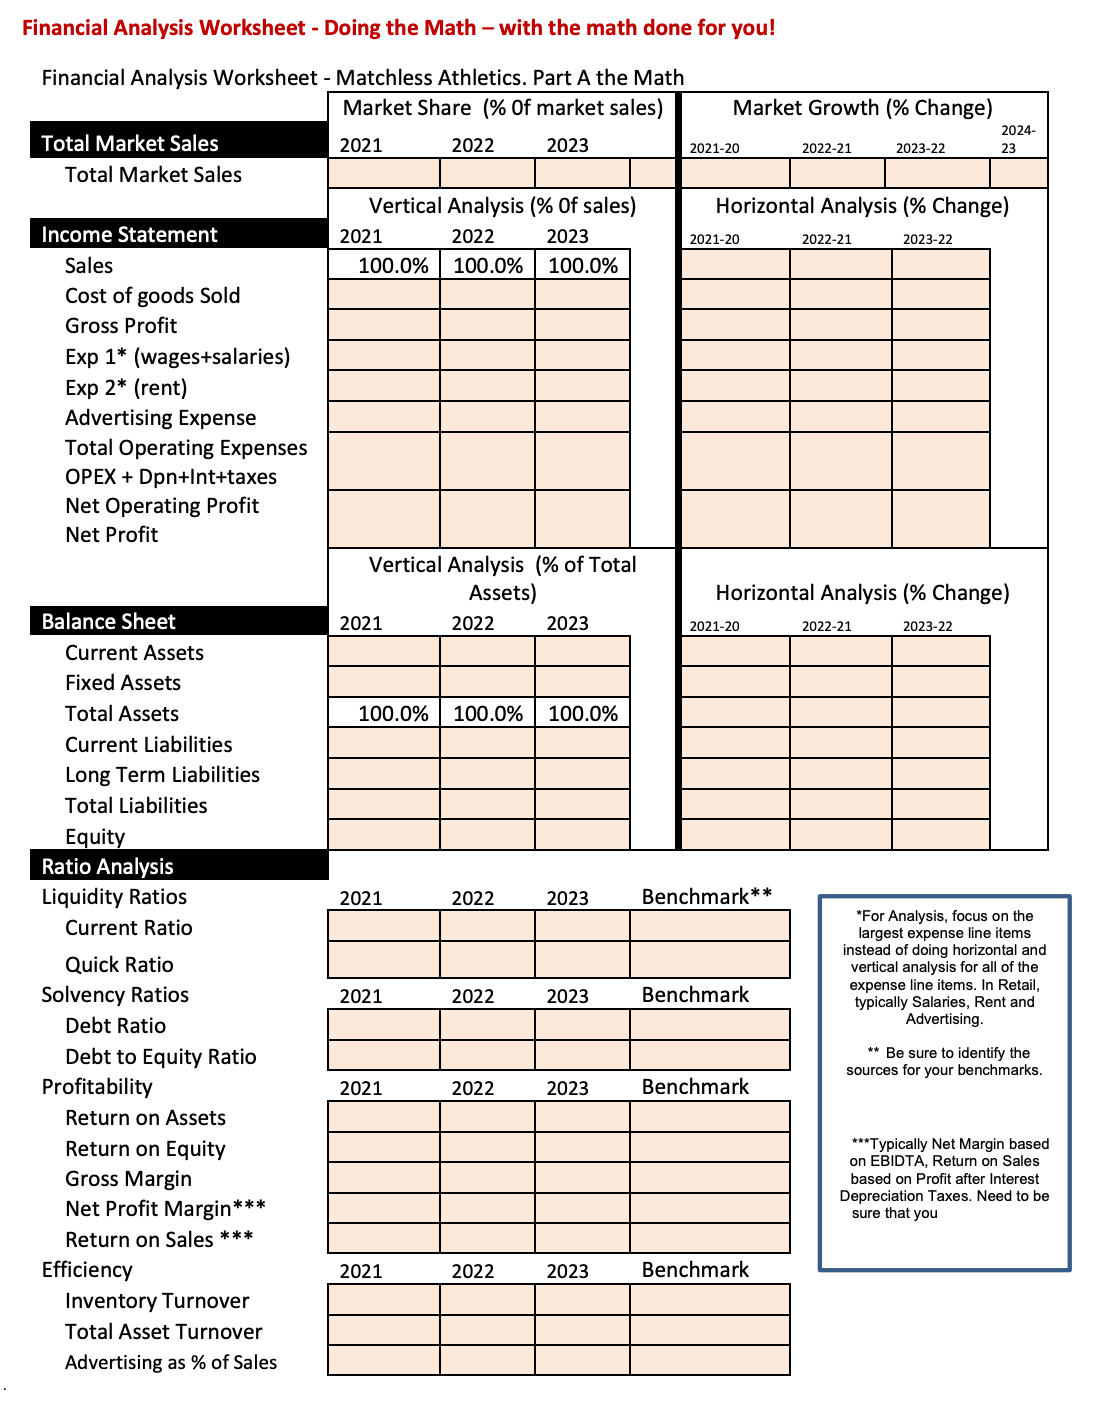
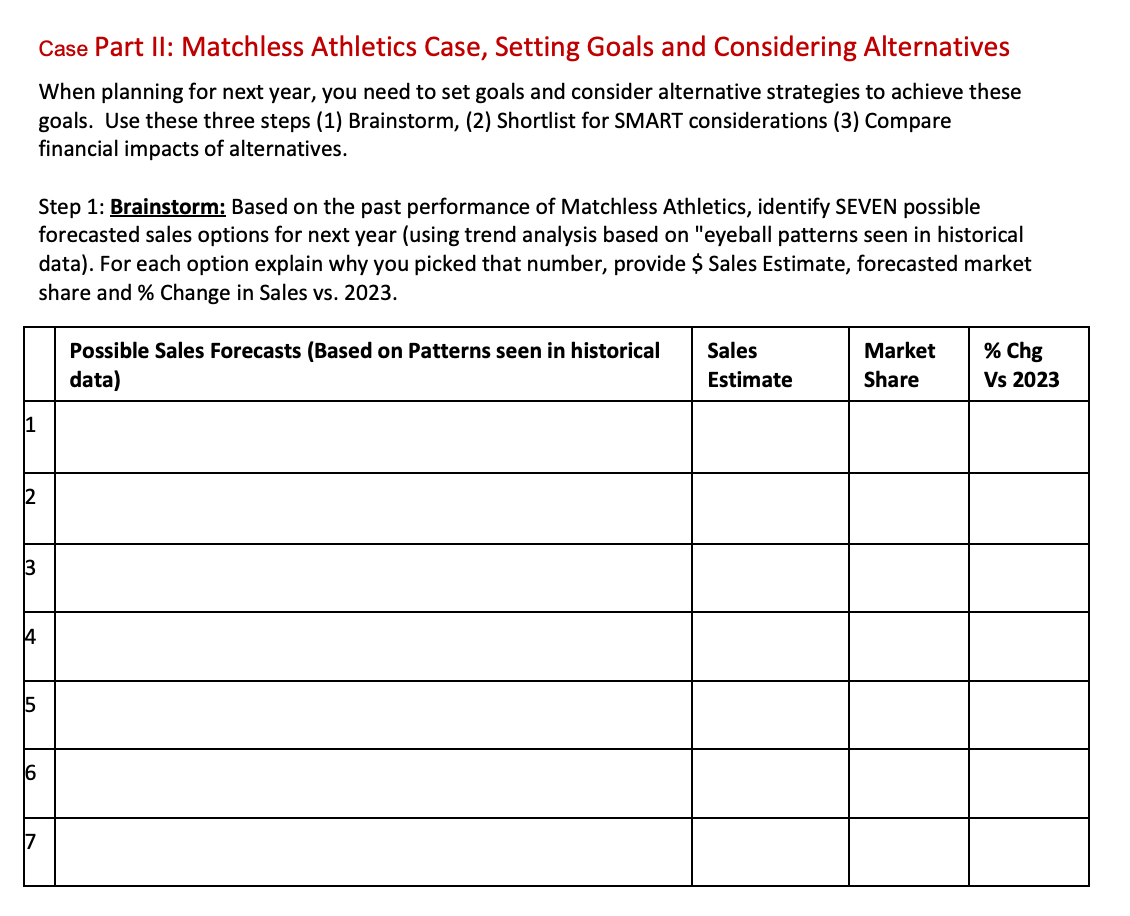
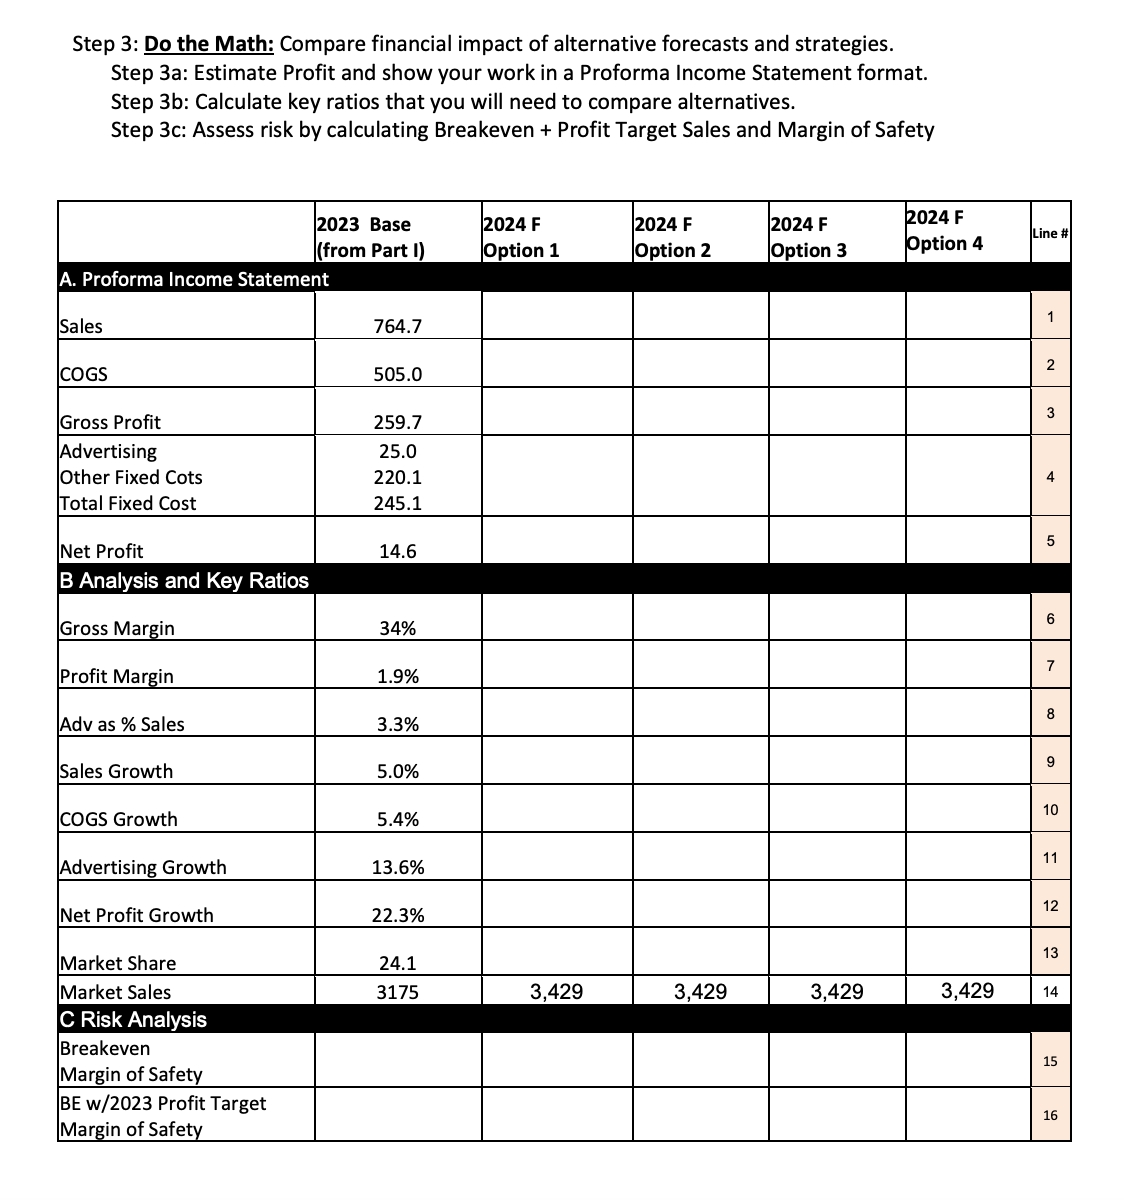
Matchless Athletics Financial Statements Market Sales and financial Statements (Income Statement and Balance Sheet for Matchless Athletics. On Income Statement, Sales are reported as a Net Number here, but includes 3% of sales for Returns and Allowances in 2023, which has been increasing each year. On Balance Sheet, Fixed Assets are reported net of Accumulated Depreciation. Matchless Athletics Sporting goods 2021 2022 2023 Market Sales for Sporting Goods 2,800 2,940 3,175 ($000) 2021 2022 2023 Sales $ 714.000 728.280 $ 764.694 Beginning Inventory $ 167.000 $ 174.000 $ 187.000 Purchases $ 483.000 $ 492.000 $ 510.000 Cost of Goods Available for Sale $ 650.000 $ 666.000 $ 697.000 LESS ending Inventory 174.000 $ 187.000 $ 192.000 Cost of Goods Sold $ 476.000 $ 479.000 $ 505.000 Gross Profit $ 238.000 $ 249.280 $ 259.694 Owners Salary $ 40.000 $ 41.200 $ 42.436 Employees Wages $ 71.300 $ 73.439 $ 75.642 Delivery Expense 5.700 $ 5.814 $ 6.200 Legal Fees $ 4.200 $ 4.200 $ 4.200 Advertising 20.700 $ 22.000 $ 25.000 Miscellaneous $ 46.100 $ 47.000 $ 48.000 Rent 11.424 $ 11.538 $ 11.654 Utilities Telephone 8.140 $ 8.140 $ 8.140 Repairs and Maintenance 3.570 $ 4.500 $ 4.500 Insurance 3.570 $ 3.570 $ 3.570 Interest 8.568 $ 8.804 $ 8.611 Deprecation $ 7.140 $ 7.140 $ 7.140 Total Operating Expenses $ Net Profit before Tax 230.412 $ 7.588 $ 237.345 $ 245.093 11.935 $ 14.601 Balance Sheet as of Dec 31 ($000) 2021 2022 2023 Current Assets Cash 10.000 18.000 $ 11.000 Net Accounts Receivable 30.000 28.000 $ Inventory 174.000 187.000 $ 32.000 192.000 Other current Assets 30.000 32.000 $ 31.231 total Current Assets 244.000 265.000 $ 266.231 Fixed Assets, Net 116.000 108.000 $ 100.000 TOTAL ASSETS 360.000 373.000 $ 366.231 LIABILITIES current Liabilities Accounts Payable 87.000 Notes Payable - Bank 39.000 Taxes Payable Accrued Expenses 1.500 0.000 Total current liabilities 127.500 109.540 $ 32.000 $ 2.000 $ 0.000 $ 143.540 $ 98.000 40.000 2.000 140.000 Financial Analysis Worksheet - Doing the Math - with the math done for you! Financial Analysis Worksheet - Matchless Athletics. Part A the Math Market Share (% of market sales) Market Growth (% Change) 2022 2023 2021-20 2022-21 2023-22 2024- 23 Horizontal Analysis (% Change) Vertical Analysis (% of sales) 2021 2022 2023 2021-20 100.0% 100.0% 100.0% Total Market Sales 2021 Total Market Sales Income Statement Sales Cost of goods Sold Exp 1* (wages+salaries) Gross Profit Exp 2* (rent) Advertising Expense Total Operating Expenses OPEX + Dpn+Int+taxes Net Operating Profit Net Profit Vertical Analysis (% of Total Assets) Balance Sheet 2021 2022 Current Assets Fixed Assets Total Assets 2023 Current Liabilities Long Term Liabilities Total Liabilities 100.0% 100.0% 100.0% 2022-21 2023-22 Horizontal Analysis (% Change) 2021-20 2022-21 2023-22 Equity Ratio Analysis Liquidity Ratios 2021 2022 2023 Benchmark** Current Ratio Quick Ratio Solvency Ratios 2021 2022 2023 Benchmark Debt Ratio Debt to Equity Ratio Profitability 2021 2022 2023 Benchmark Return on Assets Return on Equity Gross Margin *** Net Profit Margin Return on Sales *** Efficiency Inventory Turnover Total Asset Turnover Advertising as % of Sales 2021 2022 2023 Benchmark *For Analysis, focus on the largest expense line items instead of doing horizontal and vertical analysis for all of the expense line items. In Retail, typically Salaries, Rent and Advertising. ** Be sure to identify the sources for your benchmarks. ***Typically Net Margin based on EBIDTA, Return on Sales based on Profit after Interest Depreciation Taxes. Need to be sure that you Case Part II: Matchless Athletics Case, Setting Goals and Considering Alternatives When planning for next year, you need to set goals and consider alternative strategies to achieve these goals. Use these three steps (1) Brainstorm, (2) Shortlist for SMART considerations (3) Compare financial impacts of alternatives. Step 1: Brainstorm: Based on the past performance of Matchless Athletics, identify SEVEN possible forecasted sales options for next year (using trend analysis based on "eyeball patterns seen in historical data). For each option explain why you picked that number, provide $ Sales Estimate, forecasted market share and % Change in Sales vs. 2023. Possible Sales Forecasts (Based on Patterns seen in historical data) Sales Estimate Market Share % Chg Vs 2023 1 2 3 14 5 16 Step 3: Do the Math: Compare financial impact of alternative forecasts and strategies. Step 3a: Estimate Profit and show your work in a Proforma Income Statement format. Step 3b: Calculate key ratios that you will need to compare alternatives. Step 3c: Assess risk by calculating Breakeven + Profit Target Sales and Margin of Safety 2023 Base (from Part I) 2024 F 2024 F 2024 F Option 1 Option 2 Option 3 2024 F Option 4 Line # A. Proforma Income Statement Sales 1 COGS Gross Profit Advertising Other Fixed Cots Total Fixed Cost Net Profit 764.7 505.0 259.7 25.0 220.1 245.1 B Analysis and Key Ratios 14.6 2 3 4 5 6 Gross Margin 34% 7 Profit Margin 1.9% 8 Adv as % Sales 3.3% 9 Sales Growth 5.0% 10 COGS Growth 5.4% 11 Advertising Growth 13.6% 12 Net Profit Growth 22.3% 13 Market Share 24.1 Market Sales 3175 3,429 3,429 3,429 3,429 14 C Risk Analysis Breakeven Margin of Safety BE w/2023 Profit Target Margin of Safety 15 16 16 Matchless Athletics Financial Statements Market Sales and financial Statements (Income Statement and Balance Sheet for Matchless Athletics. On Income Statement, Sales are reported as a Net Number here, but includes 3% of sales for Returns and Allowances in 2023, which has been increasing each year. On Balance Sheet, Fixed Assets are reported net of Accumulated Depreciation. Matchless Athletics Sporting goods 2021 2022 2023 Market Sales for Sporting Goods 2,800 2,940 3,175 ($000) 2021 2022 2023 Sales $ 714.000 728.280 $ 764.694 Beginning Inventory $ 167.000 $ 174.000 $ 187.000 Purchases $ 483.000 $ 492.000 $ 510.000 Cost of Goods Available for Sale $ 650.000 $ 666.000 $ 697.000 LESS ending Inventory 174.000 $ 187.000 $ 192.000 Cost of Goods Sold $ 476.000 $ 479.000 $ 505.000 Gross Profit $ 238.000 $ 249.280 $ 259.694 Owners Salary $ 40.000 $ 41.200 $ 42.436 Employees Wages $ 71.300 $ 73.439 $ 75.642 Delivery Expense 5.700 $ 5.814 $ 6.200 Legal Fees $ 4.200 $ 4.200 $ 4.200 Advertising 20.700 $ 22.000 $ 25.000 Miscellaneous $ 46.100 $ 47.000 $ 48.000 Rent 11.424 $ 11.538 $ 11.654 Utilities Telephone 8.140 $ 8.140 $ 8.140 Repairs and Maintenance 3.570 $ 4.500 $ 4.500 Insurance 3.570 $ 3.570 $ 3.570 Interest 8.568 $ 8.804 $ 8.611 Deprecation $ 7.140 $ 7.140 $ 7.140 Total Operating Expenses $ Net Profit before Tax 230.412 $ 7.588 $ 237.345 $ 245.093 11.935 $ 14.601 Balance Sheet as of Dec 31 ($000) 2021 2022 2023 Current Assets Cash 10.000 18.000 $ 11.000 Net Accounts Receivable 30.000 28.000 $ Inventory 174.000 187.000 $ 32.000 192.000 Other current Assets 30.000 32.000 $ 31.231 total Current Assets 244.000 265.000 $ 266.231 Fixed Assets, Net 116.000 108.000 $ 100.000 TOTAL ASSETS 360.000 373.000 $ 366.231 LIABILITIES current Liabilities Accounts Payable 87.000 Notes Payable - Bank 39.000 Taxes Payable Accrued Expenses 1.500 0.000 Total current liabilities 127.500 109.540 $ 32.000 $ 2.000 $ 0.000 $ 143.540 $ 98.000 40.000 2.000 140.000 Financial Analysis Worksheet - Doing the Math - with the math done for you! Financial Analysis Worksheet - Matchless Athletics. Part A the Math Market Share (% of market sales) Market Growth (% Change) 2022 2023 2021-20 2022-21 2023-22 2024- 23 Horizontal Analysis (% Change) Vertical Analysis (% of sales) 2021 2022 2023 2021-20 100.0% 100.0% 100.0% Total Market Sales 2021 Total Market Sales Income Statement Sales Cost of goods Sold Exp 1* (wages+salaries) Gross Profit Exp 2* (rent) Advertising Expense Total Operating Expenses OPEX + Dpn+Int+taxes Net Operating Profit Net Profit Vertical Analysis (% of Total Assets) Balance Sheet 2021 2022 Current Assets Fixed Assets Total Assets 2023 Current Liabilities Long Term Liabilities Total Liabilities 100.0% 100.0% 100.0% 2022-21 2023-22 Horizontal Analysis (% Change) 2021-20 2022-21 2023-22 Equity Ratio Analysis Liquidity Ratios 2021 2022 2023 Benchmark** Current Ratio Quick Ratio Solvency Ratios 2021 2022 2023 Benchmark Debt Ratio Debt to Equity Ratio Profitability 2021 2022 2023 Benchmark Return on Assets Return on Equity Gross Margin *** Net Profit Margin Return on Sales *** Efficiency Inventory Turnover Total Asset Turnover Advertising as % of Sales 2021 2022 2023 Benchmark *For Analysis, focus on the largest expense line items instead of doing horizontal and vertical analysis for all of the expense line items. In Retail, typically Salaries, Rent and Advertising. ** Be sure to identify the sources for your benchmarks. ***Typically Net Margin based on EBIDTA, Return on Sales based on Profit after Interest Depreciation Taxes. Need to be sure that you Case Part II: Matchless Athletics Case, Setting Goals and Considering Alternatives When planning for next year, you need to set goals and consider alternative strategies to achieve these goals. Use these three steps (1) Brainstorm, (2) Shortlist for SMART considerations (3) Compare financial impacts of alternatives. Step 1: Brainstorm: Based on the past performance of Matchless Athletics, identify SEVEN possible forecasted sales options for next year (using trend analysis based on "eyeball patterns seen in historical data). For each option explain why you picked that number, provide $ Sales Estimate, forecasted market share and % Change in Sales vs. 2023. Possible Sales Forecasts (Based on Patterns seen in historical data) Sales Estimate Market Share % Chg Vs 2023 1 2 3 14 5 16 Step 3: Do the Math: Compare financial impact of alternative forecasts and strategies. Step 3a: Estimate Profit and show your work in a Proforma Income Statement format. Step 3b: Calculate key ratios that you will need to compare alternatives. Step 3c: Assess risk by calculating Breakeven + Profit Target Sales and Margin of Safety 2023 Base (from Part I) 2024 F 2024 F 2024 F Option 1 Option 2 Option 3 2024 F Option 4 Line # A. Proforma Income Statement Sales 1 COGS Gross Profit Advertising Other Fixed Cots Total Fixed Cost Net Profit 764.7 505.0 259.7 25.0 220.1 245.1 B Analysis and Key Ratios 14.6 2 3 4 5 6 Gross Margin 34% 7 Profit Margin 1.9% 8 Adv as % Sales 3.3% 9 Sales Growth 5.0% 10 COGS Growth 5.4% 11 Advertising Growth 13.6% 12 Net Profit Growth 22.3% 13 Market Share 24.1 Market Sales 3175 3,429 3,429 3,429 3,429 14 C Risk Analysis Breakeven Margin of Safety BE w/2023 Profit Target Margin of Safety 15 16 16
Expert Answer:

Related Book For 
Interpreting and Analyzing Financial Statements
ISBN: 978-0132746243
6th edition
Authors: Karen P. Schoenebeck, Mark P. Holtzman
Posted Date:
Students also viewed these accounting questions
-
plash House Equipment is a small store in St. Catharines, Florida, that sells water sport equipment to families and sporting groups in the neighborhood. The business was registered over two years...
-
Use the attached "words.txt" file to store the words along with their ranks in an AVL tree. Then provide the user the option to search for any word. If the word exists the program displays the rank...
-
What are the different relays that employed for protection of apparatus and transmission lines?
-
For which of the following ions does the formal charge give a fairly accurate picture of where the charge really is? Explain in each case. (a) NH4 (b) H3O: (C) NH2 (d) CH3
-
Explain whether a best strategy exists for constructing SRMF portfolios.
-
A conducting sphere has a radius of \(2.25 \mathrm{~m}\) and carries a positive surplus charge of \(35.0 \mathrm{mC}\). A protective layer of barium titanate is applied to the surface of the sphere...
-
Earth Company expects to operate at 80% of its productive capacity of 25,000 units per month. At this planned level, the company expects to use 40,000 standard hours of direct labor. Overhead is...
-
7. A vertical spring is fixed to one of its end and a massless plank fitted to the other end. A block is released from a height has shown. Spring is in relaxed position. Then choose the correct...
-
Revisit motion of double pendulum. Replace velocity component by momentum in its kinetic energy and consider F = T F2 = U And F3 = H Verify Jacobi's identity
-
Make a list of 10 prominent entrepreneurs who are women, minorities, or seniors (55 years or older when their firms were started). Single out one of these entrepreneurs and provide a brief overview...
-
In December 2015, Apple had cash of $38.42 billion, current assets of $76.47 billion, and current liabilities of $76.29 billion. It also had inventories of $2.45 billion. a. What was Apples current...
-
Large firms and smaller entrepreneurial firms play different roles in business and society and can often produce the best results by partnering with each other rather than acting as adversaries. The...
-
1 mol of steam is initially at 10 bar and 200C. The surroundings are at 20C and 1 bar. (a) Calculate the exergy of the system. (b) Calculate the change in exergy for a process where the steam is...
-
In December 2015, General Electric (GE) had a book value of equity of $97.6 billion, 9.6 billion shares outstanding, and a market price of $32.79 per share. GE also had cash of $103.4 billion, and...
-
Write a paper in which you address the following: Select the suitable medium for transferring a motor shaft temperature data acquired using RTD sensor to a control room. The mediums are: mechanical...
-
According to a New York Times columnist, The estate tax affects a surprisingly small number of people. In 2003, . . . just 1.25 percent of all deaths resulted in taxable estates, with most of them...
-
For the particular case of hard spheres, the pressure in the virial equation of state is determined by evaluating the pair correlation function at contact. Write the pair correlation function as...
-
(a) For a dilute gas, the pair correlation function \(g(r)\) may be approximated as \[g(r) \simeq \exp \{-u(r) / k T\}\] Show that, under this approximation, the virial equation of state (10.7.11)...
-
Show that, in the case of a degenerate gas of fermions \(\left(T \ll T_{F} ight)\), the correlation function \(g(r)\), for \(r \gg \hbar / p_{F}\), reduces to the expression \[g(r)-1=-\frac{3(m k...

Study smarter with the SolutionInn App