

Question: Material: Variance Analysis and Cost Behavior Please answer the question completely and show workings thank you! Question 6 (b) Predicting costs Rohell Ltd produces children's
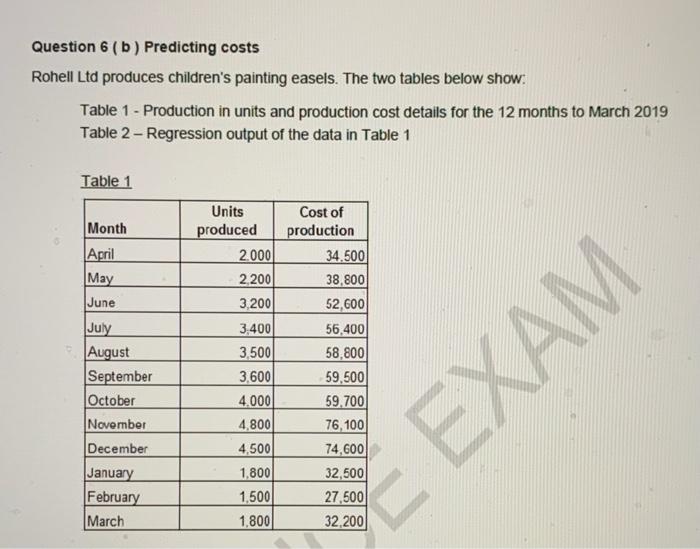
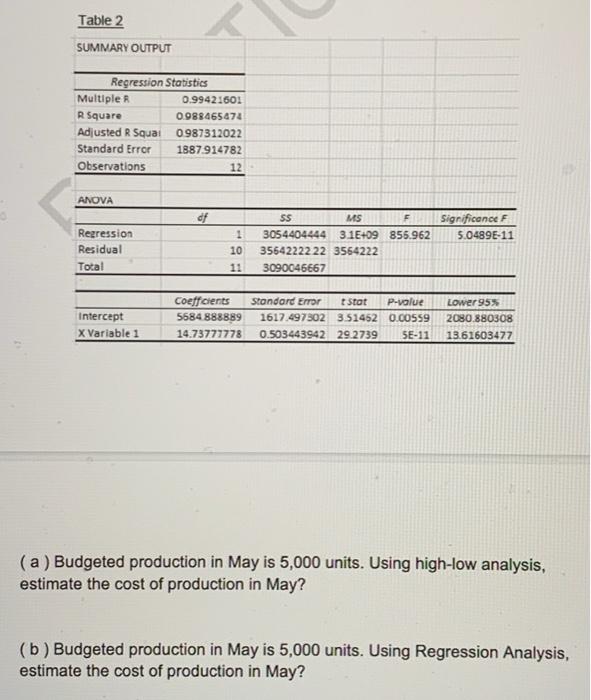
Question 6 (b) Predicting costs Rohell Ltd produces children's painting easels. The two tables below show. Table 1 - Production in units and production cost details for the 12 months to March 2019 Table 2 - Regression output of the data in Table 1 Table 1 Month April May June July August September October November December January February March Units Cost of produced production 2.000 34.500 2.2001 38,800 3.2001 52,600 3,400 56,400 3.500 58,800 3.600 59,500 4.000 59.700 4.800 76,100 4,500 74,600 1,800 32,500 1,500 27,500 1.800 32,200 EXAM Table 2 SUMMARY OUTPUT Regression Statistics Multiple 0.99421601 R Square 0.988465474 Adjusted R Squal 0987312022 Standard Error 1887.914782 Observations 12 ANOVA df Significance F 5.0489E-11 Regression Residual Total 1 10 11 SS MS F 3054404444 3.1E+09 855.962 3554222222 3564222 3090046667 Intercept X Variable 1 Coefficients 5584 888889 14.73777778 Standard Error Stot P-value 1617.497302 3.51462 0.00559 0.503443942 29.2739 5E-11 Lower 95% 2080.880308 13.61603477 (a) Budgeted production in May is 5,000 units. Using high-low analysis, estimate the cost of production in May? (b) Budgeted production in May is 5,000 units. Using Regression Analysis, estimate the cost of production in May
Step by Step Solution
There are 3 Steps involved in it

Get step-by-step solutions from verified subject matter experts