

Question: Materials: You do not need to purchase any materials. Instead, you can rely on the information provided below and the Excel file with financial information
Materials: You do not need to purchase any materials. Instead, you can rely on the information provided below and the Excel file with financial information on Canvas.
Background: New Heritage Doll Company (NHDC) produces and sells dolls for children. Founded in 1985, the company had 450 employees and $245 million of revenue by 2009. The company is weighing project proposals for upcoming capital budgeting meetings.
The Product Dilemma: In particular, the company is trying to decide between two proposals for its product lines. The first option is to expand the successful Match My Doll Clothing Line to include matching all-season clothing. The second option is a new initiative, the Design Your Own Doll Line, which employs web-based doll-design software to let users customize their doll.
Assumptions: The key assumptions are listed below including explanations and helpful hints for some:
1. The marginal tax rate is 40%.
2. The benchmark discount rate is 8.40%.
3. You must compute a terminal value for each project that encapsulates the assumption that free cash flows will grow forever from 2020 at a constant terminal growth rate. In your benchmark calculations, assume that this terminal growth rate of 3.0%.
Your Submission: Your report must include the following analysis and answers:
1. Compute a net present value (NPV) for each project using the provided projections and assumptions stated above. Which project creates more value?
2. Compute the internal rate of return (IRR) for each project. How do they compare to NPV as tools for evaluating the projects?
3. Perform a sensitivity analysis for your NPV calculations for discount rates and terminal value (TV) growth rates. Specifically, you should produce tables of the following form.
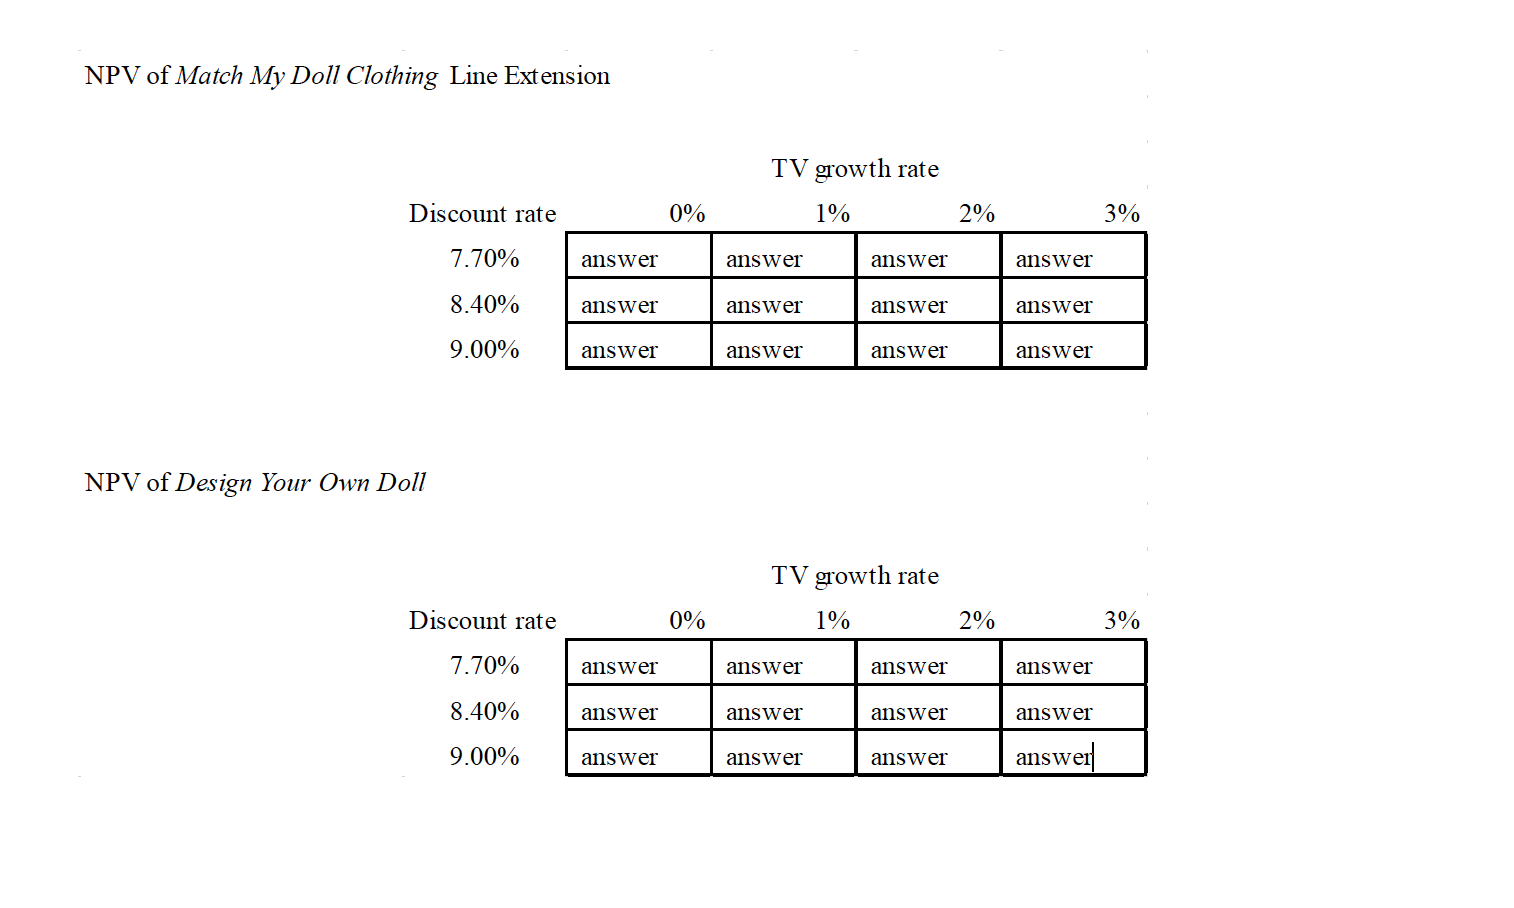
4. Based on your analysis, what is your final recommendation for the project selection? Make sure to succinctly explain your reasoning based on your analysis.
Make sure to include as exhibits the the full tables that support your calculations.
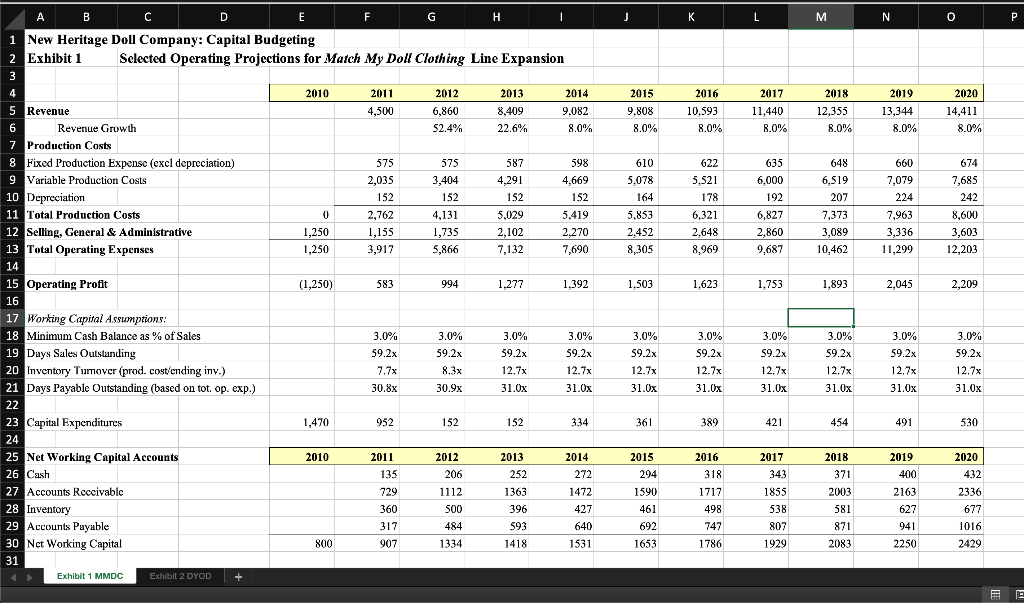
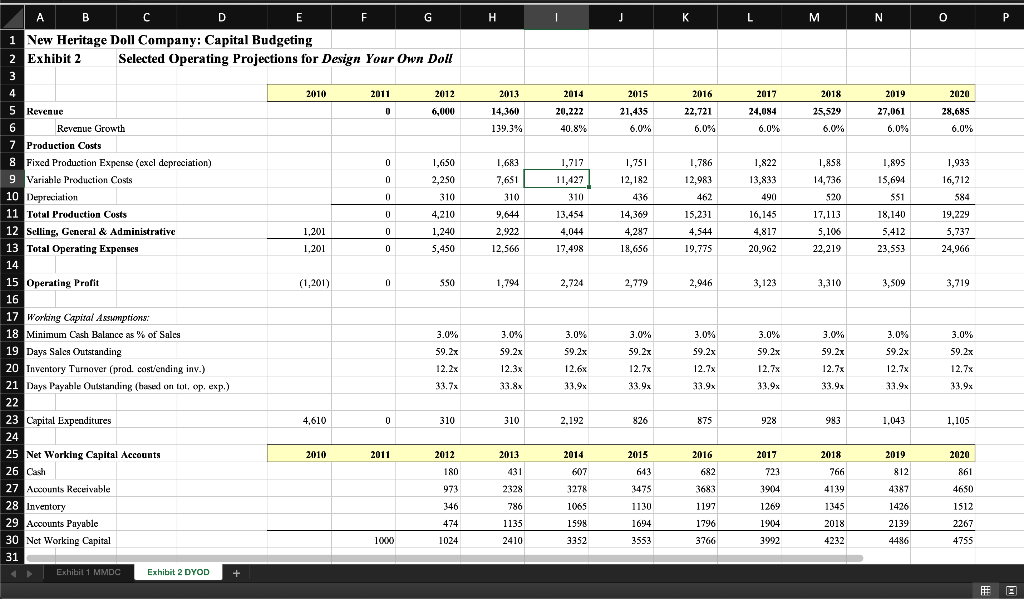
NPV of Match My Doll Clothing Line Extension TV growth rate 1% 0% 2% 3% Discount rate 7.70% 8.40% answer answer answer answer answer answer answer answer 9.00% answer answer answer answer NPV of Design Your Own Doll TV growth rate 1% Discount rate 0% 2% 3% 7.70% answer answer answer answer 8.40% answer answer answer answer 9.00% answer answer answer answer J K L M N O P A B C D E F G H I 1 New Heritage Doll Company: Capital Budgeting 2 Exhibit 1 Selected Operating Projections for Match My Doll Clothing Line Expansion 2010 2011 4,500 2012 6,860 52.4% 2013 8,409 22.6% 2014 9,082 8.0% 2015 9.808 8.0% 2016 10,593 8.0% 2017 11,440 8.0% 2018 12,355 8.0% 2019 13,344 8.0% 2020 14,411 8.0% 622 575 3,404 587 4,291 598 4,669 5 Revenue 6 Revenue Growth 7 Production Costs 8 Fixed Production Expense (excl depreciation) 9 Variable Production Costs 10 Depreciation 11 Total Production Costs 12 Selling, General & Administrative 13 Total Operating Expenses 14 15 Operating Profit 648 6,519 207 152 152 575 2,035 152 2,762 1,155 3,917 152 4,131 610 5,078 164 5,853 2,452 8,305 635 6,000 192 6,827 2.860 9,687 660 7,079 224 7,963 3,336 11,299 5,521 178 6,321 2.648 8,969 674 7,685 242 8,600 3,603 12,203 1.250 1,250 5,029 2,102 7,132 1,735 5,866 5.419 2,270 7,690 7,373 3,089 10,462 (1,250) 583 994 1,277 1,392 1,503 1,623 1,753 1,893 2,045 2,209 16 3.0% 17 Working Capital Assumptions: 18 Minimum Cash Balance as % of Sales 19 Days Sales Outstanding 20 Inventory Tumover (prod. cost/ending inv.) 21 Days Payable Outstanding (based on tot. op. exp.) 3.0% 59.2x 3.0% 59.2x 3.0% 59.2x 7.7x 30.8x 59.2x 8.3x 30.9x 3.0% 59.2x 12.7x 31.0x 12.7x 3.0% 59.2x 12.7x 31.0x 3.0% 59.2x 12.7x 31.0x 3.0% 59.2x 12.7x 31.0x 3.0% 59.2x 12.7x 31.0x 3.0% 59.2x 12.7x 31.0x 12.7% 31.0x 31.0x 1,470 952 152 1 152 334 361 389 421 454 491 530 2010 2015 2018 294 371 23 Capital Expenditures 24 25 Net Working Capital Accounts 26 Cash 27 Accounts Receivable 28 Inventory 29 Accounts Payable 30 Net Working Capital 2011 135 729 360 2012 206 1112 500 484 1334 2013 252 1363 396 593 1418 2014 272 1472 427 640 1531 1590 461 692 1653 2016 2016 318 1717 498 747 1786 2017 343 1855 538 807 1929 2003 581 871 2083 2019 400 2163 627 941 2 250 2020 432 2336 677 1016 2 429 317 800 907 Exhibit 1 MMDC Exhibit 2 DYOD + F E H I M N P A B C D E F G 1 New Heritage Doll Company: Capital Budgeting 2 Exhibit 2 Selected Operating Projections for Design Your Own Doll 2010 2011 0 2012 6,000 2013 14,360 139.3% 2014 20,222 40.8% 2015 21,435 6.0% 2016 22,721 6.0% 2017 24,084 6.0% 2018 2 5,529 6.0% 2019 27,061 2020 28,685 6.0% 6.0% 5 Revenue 6 Revenue Growth 7 Production Costs 8 Fixed Production Expense (excl depreciation) 9 Variable Production Costs 10 Depreciation 11 Total Production Costs 12 Selling, General & Administrative 13 Total Operating Expenses 1,717 11,427 1.751 12,182 1.786 12,983 1,858 14,736 520 310 436 462 1,650 2,250 310 4,210 1,240 5,450 1.683 7,651 310 9,644 2,922 12.566 1,822 13,833 490 16.145 4,817 20,962 1,895 15,694 351 18,140 5,412 23,553 1,933 16,712 584 19.229 5.737 24,966 1,201 1.201 13.454 4,044 17,498 14,369 4,287 18,656 15,231 4,544 19.775 17,113 5,106 22,219 15 Operating Profit (1,201) 550 1,794 2,724 2,779 2,946 3,123 3,310 3,509 3,719 3.0% 17 Working Capital Assumptions: 18 Minimum Cash Balance as % of Sales 19 Days Sales Outstanding 20 Inventory Turnover (prod. cost'ending inv.) 21 Days Payable Outstanding (based on tot op, exp.) 3.0% 59.2x 12. 2x 33.7x 59.2x 12.3x 33.8% 3.0% 59.2x 12.6x 3.0% 59.2x 12.7x 33.9x 3.0% 59.2x 12.7x 33.9% 3.0% 59.2x 12.7x 33.9x 3.% 59.2x 12.7x 33.9% 3.0% 59.2x 12.7x 33.9x 3.0% 59.2x 12.7x 33.9x 23 Capital Expenditures 4,610 0 310 310 2,192 826 875 928 983 1,043 1,105 2010 2011 2014 2012 180 973 2013 431 2328 2019 812 4387 2020 861 607 4650 25 Net Working Capital Accounts 26 Cash 27 Accounts Receivable 28 Inventory 29 Accounts Payable 30 Net Working Capital 2015 643 3475 1130 1694 3553 2016 682 3683 1197 1796 3766 2017 723 3904 1269 1904 3992 3278 1065 1998 3352 2018 766 4139 1345 2018 4232 346 786 1426 474 1024 1135 2410 2139 4486 1512 2267 4755 1000 Exhibit 1 MMDC Exhibit 2 DYOD + NPV of Match My Doll Clothing Line Extension TV growth rate 1% 0% 2% 3% Discount rate 7.70% 8.40% answer answer answer answer answer answer answer answer 9.00% answer answer answer answer NPV of Design Your Own Doll TV growth rate 1% Discount rate 0% 2% 3% 7.70% answer answer answer answer 8.40% answer answer answer answer 9.00% answer answer answer answer J K L M N O P A B C D E F G H I 1 New Heritage Doll Company: Capital Budgeting 2 Exhibit 1 Selected Operating Projections for Match My Doll Clothing Line Expansion 2010 2011 4,500 2012 6,860 52.4% 2013 8,409 22.6% 2014 9,082 8.0% 2015 9.808 8.0% 2016 10,593 8.0% 2017 11,440 8.0% 2018 12,355 8.0% 2019 13,344 8.0% 2020 14,411 8.0% 622 575 3,404 587 4,291 598 4,669 5 Revenue 6 Revenue Growth 7 Production Costs 8 Fixed Production Expense (excl depreciation) 9 Variable Production Costs 10 Depreciation 11 Total Production Costs 12 Selling, General & Administrative 13 Total Operating Expenses 14 15 Operating Profit 648 6,519 207 152 152 575 2,035 152 2,762 1,155 3,917 152 4,131 610 5,078 164 5,853 2,452 8,305 635 6,000 192 6,827 2.860 9,687 660 7,079 224 7,963 3,336 11,299 5,521 178 6,321 2.648 8,969 674 7,685 242 8,600 3,603 12,203 1.250 1,250 5,029 2,102 7,132 1,735 5,866 5.419 2,270 7,690 7,373 3,089 10,462 (1,250) 583 994 1,277 1,392 1,503 1,623 1,753 1,893 2,045 2,209 16 3.0% 17 Working Capital Assumptions: 18 Minimum Cash Balance as % of Sales 19 Days Sales Outstanding 20 Inventory Tumover (prod. cost/ending inv.) 21 Days Payable Outstanding (based on tot. op. exp.) 3.0% 59.2x 3.0% 59.2x 3.0% 59.2x 7.7x 30.8x 59.2x 8.3x 30.9x 3.0% 59.2x 12.7x 31.0x 12.7x 3.0% 59.2x 12.7x 31.0x 3.0% 59.2x 12.7x 31.0x 3.0% 59.2x 12.7x 31.0x 3.0% 59.2x 12.7x 31.0x 3.0% 59.2x 12.7x 31.0x 12.7% 31.0x 31.0x 1,470 952 152 1 152 334 361 389 421 454 491 530 2010 2015 2018 294 371 23 Capital Expenditures 24 25 Net Working Capital Accounts 26 Cash 27 Accounts Receivable 28 Inventory 29 Accounts Payable 30 Net Working Capital 2011 135 729 360 2012 206 1112 500 484 1334 2013 252 1363 396 593 1418 2014 272 1472 427 640 1531 1590 461 692 1653 2016 2016 318 1717 498 747 1786 2017 343 1855 538 807 1929 2003 581 871 2083 2019 400 2163 627 941 2 250 2020 432 2336 677 1016 2 429 317 800 907 Exhibit 1 MMDC Exhibit 2 DYOD + F E H I M N P A B C D E F G 1 New Heritage Doll Company: Capital Budgeting 2 Exhibit 2 Selected Operating Projections for Design Your Own Doll 2010 2011 0 2012 6,000 2013 14,360 139.3% 2014 20,222 40.8% 2015 21,435 6.0% 2016 22,721 6.0% 2017 24,084 6.0% 2018 2 5,529 6.0% 2019 27,061 2020 28,685 6.0% 6.0% 5 Revenue 6 Revenue Growth 7 Production Costs 8 Fixed Production Expense (excl depreciation) 9 Variable Production Costs 10 Depreciation 11 Total Production Costs 12 Selling, General & Administrative 13 Total Operating Expenses 1,717 11,427 1.751 12,182 1.786 12,983 1,858 14,736 520 310 436 462 1,650 2,250 310 4,210 1,240 5,450 1.683 7,651 310 9,644 2,922 12.566 1,822 13,833 490 16.145 4,817 20,962 1,895 15,694 351 18,140 5,412 23,553 1,933 16,712 584 19.229 5.737 24,966 1,201 1.201 13.454 4,044 17,498 14,369 4,287 18,656 15,231 4,544 19.775 17,113 5,106 22,219 15 Operating Profit (1,201) 550 1,794 2,724 2,779 2,946 3,123 3,310 3,509 3,719 3.0% 17 Working Capital Assumptions: 18 Minimum Cash Balance as % of Sales 19 Days Sales Outstanding 20 Inventory Turnover (prod. cost'ending inv.) 21 Days Payable Outstanding (based on tot op, exp.) 3.0% 59.2x 12. 2x 33.7x 59.2x 12.3x 33.8% 3.0% 59.2x 12.6x 3.0% 59.2x 12.7x 33.9x 3.0% 59.2x 12.7x 33.9% 3.0% 59.2x 12.7x 33.9x 3.% 59.2x 12.7x 33.9% 3.0% 59.2x 12.7x 33.9x 3.0% 59.2x 12.7x 33.9x 23 Capital Expenditures 4,610 0 310 310 2,192 826 875 928 983 1,043 1,105 2010 2011 2014 2012 180 973 2013 431 2328 2019 812 4387 2020 861 607 4650 25 Net Working Capital Accounts 26 Cash 27 Accounts Receivable 28 Inventory 29 Accounts Payable 30 Net Working Capital 2015 643 3475 1130 1694 3553 2016 682 3683 1197 1796 3766 2017 723 3904 1269 1904 3992 3278 1065 1998 3352 2018 766 4139 1345 2018 4232 346 786 1426 474 1024 1135 2410 2139 4486 1512 2267 4755 1000 Exhibit 1 MMDC Exhibit 2 DYOD +
Step by Step Solution
There are 3 Steps involved in it

Get step-by-step solutions from verified subject matter experts