

Question: MATH 1020 Calculus Concepts 1.5 Learning Activity 1.5 DMS 3. Revenue data for Merck and Co. Inc. are given in the table below. Year 1995

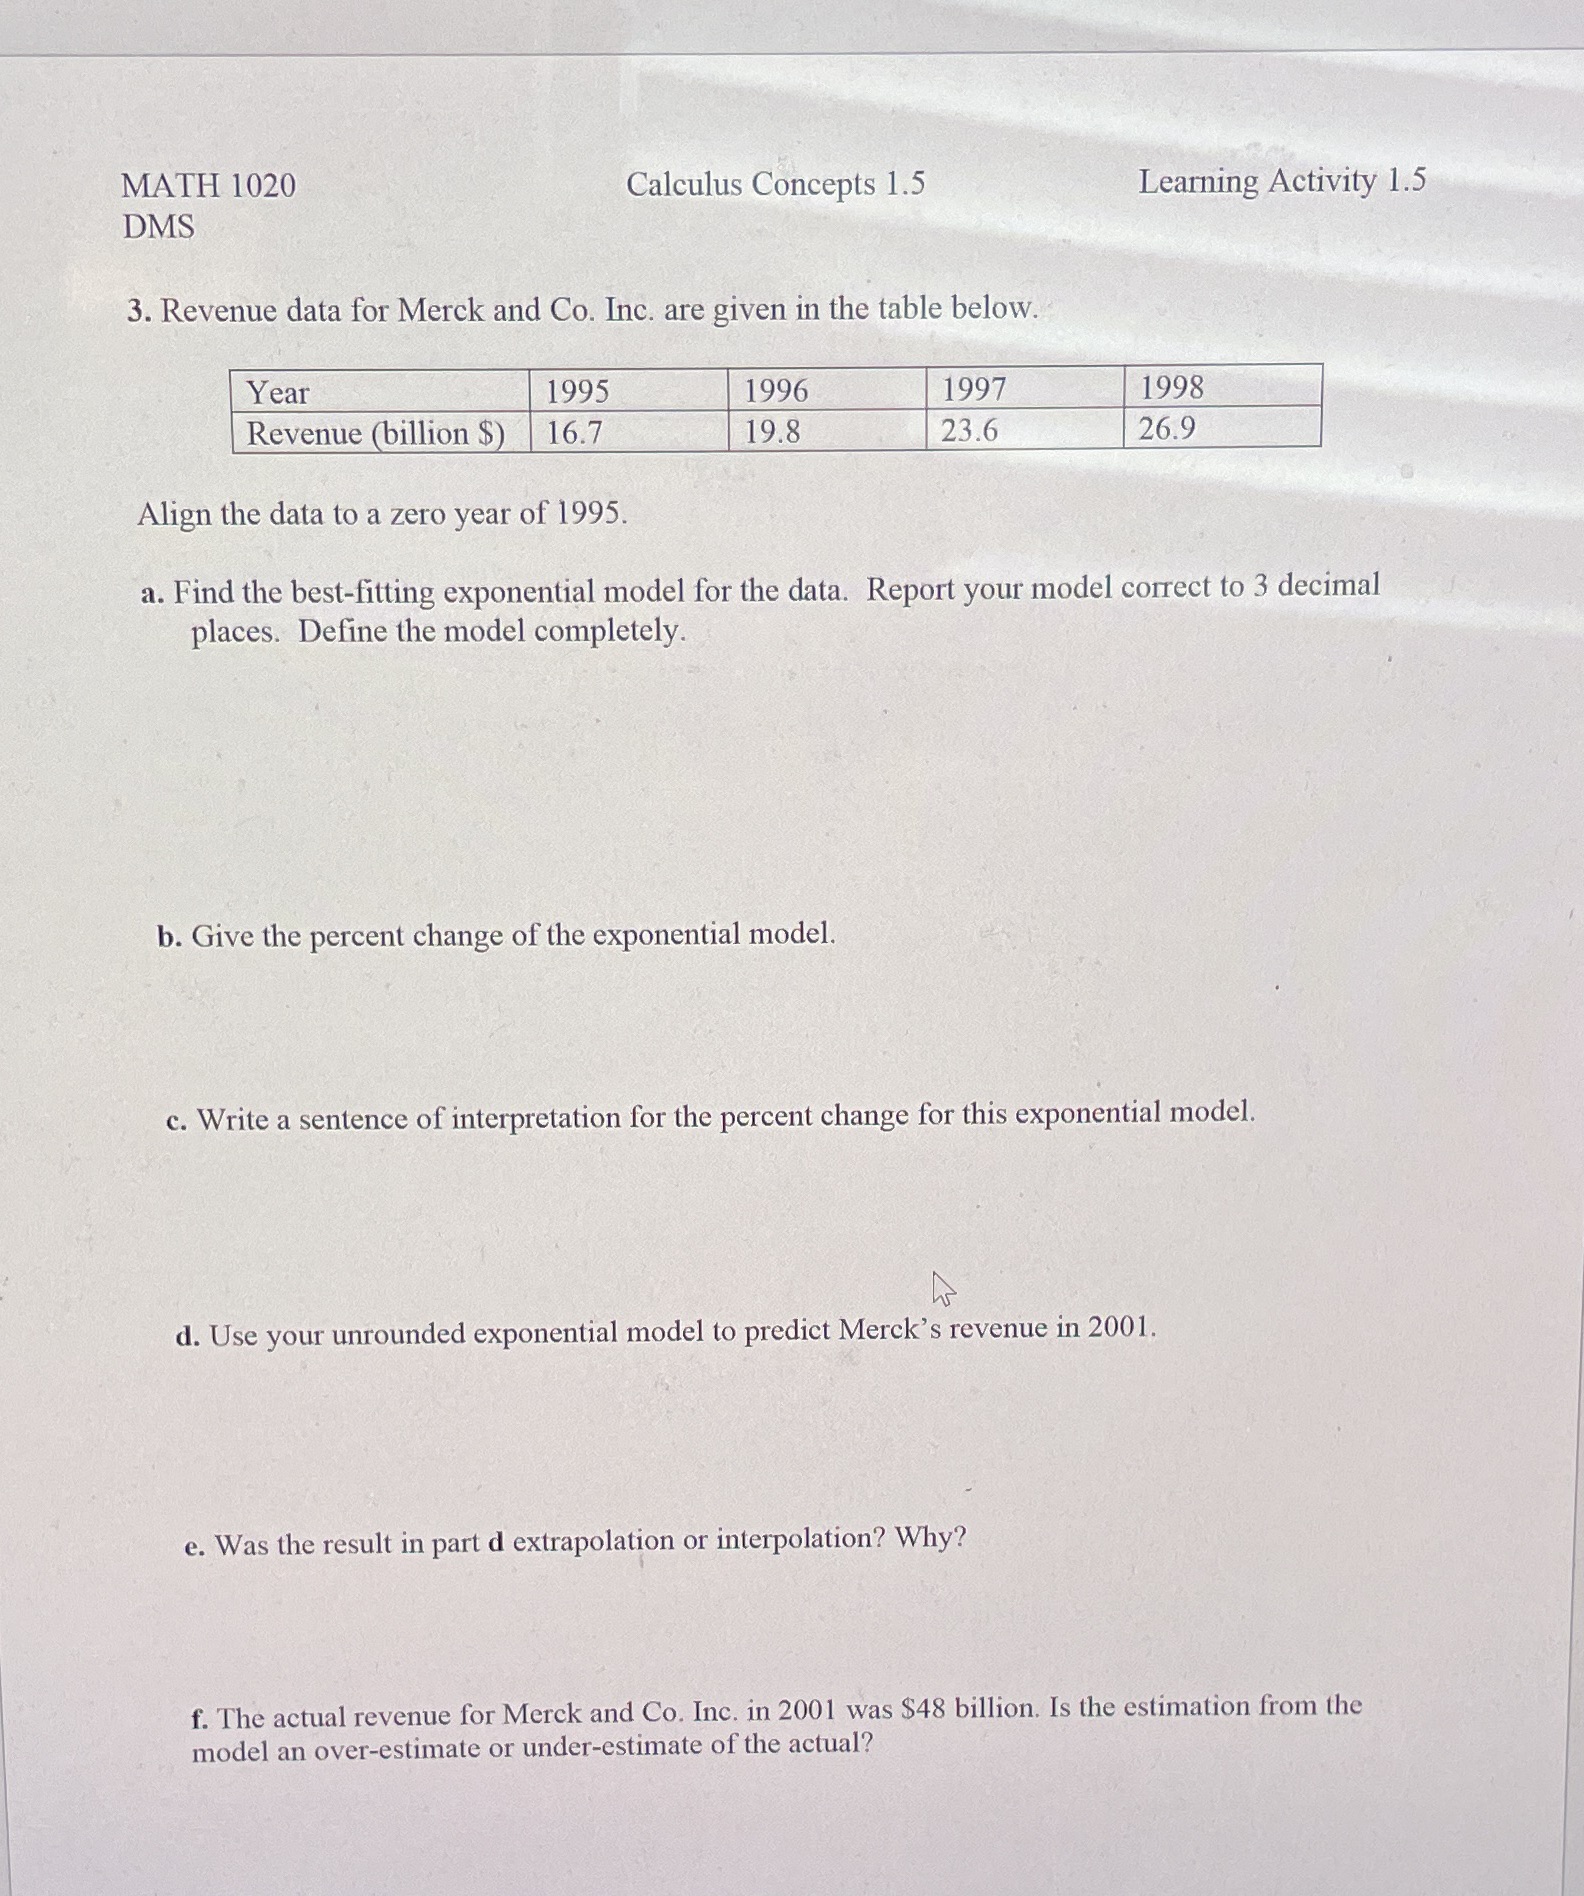
MATH 1020 Calculus Concepts 1.5 Learning Activity 1.5 DMS 3. Revenue data for Merck and Co. Inc. are given in the table below. Year 1995 1996 1997 1998 Revenue (billion $) 16.7 19.8 23.6 26.9 Align the data to a zero year of 1995. a. Find the best-fitting exponential model for the data. Report your model correct to 3 decimal places. Define the model completely. b. Give the percent change of the exponential model. c. Write a sentence of interpretation for the percent change for this exponential model. d. Use your unrounded exponential model to predict Merck's revenue in 2001. e. Was the result in part d extrapolation or interpolation? Why? f. The actual revenue for Merck and Co. Inc. in 2001 was $48 billion. Is the estimation from the model an over-estimate or under-estimate of the actual
Step by Step Solution
There are 3 Steps involved in it

Get step-by-step solutions from verified subject matter experts