

Question: MATH 1030 - Statistics Project Part 2 Worth: 80 points Deadline: Due by the end of Module 12 Directions: Please download and save this Microsoft


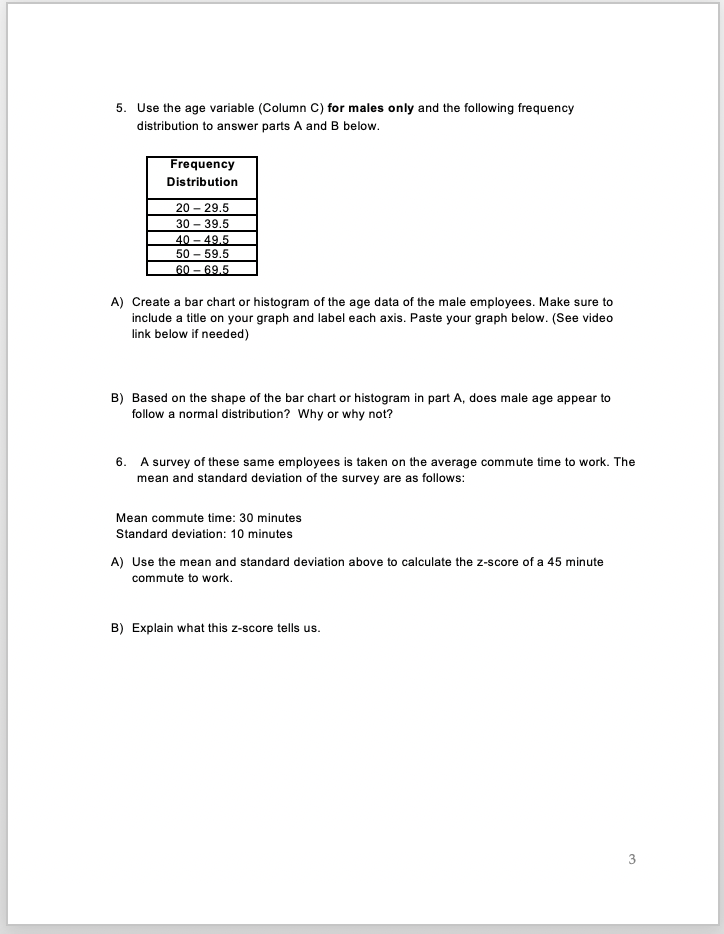
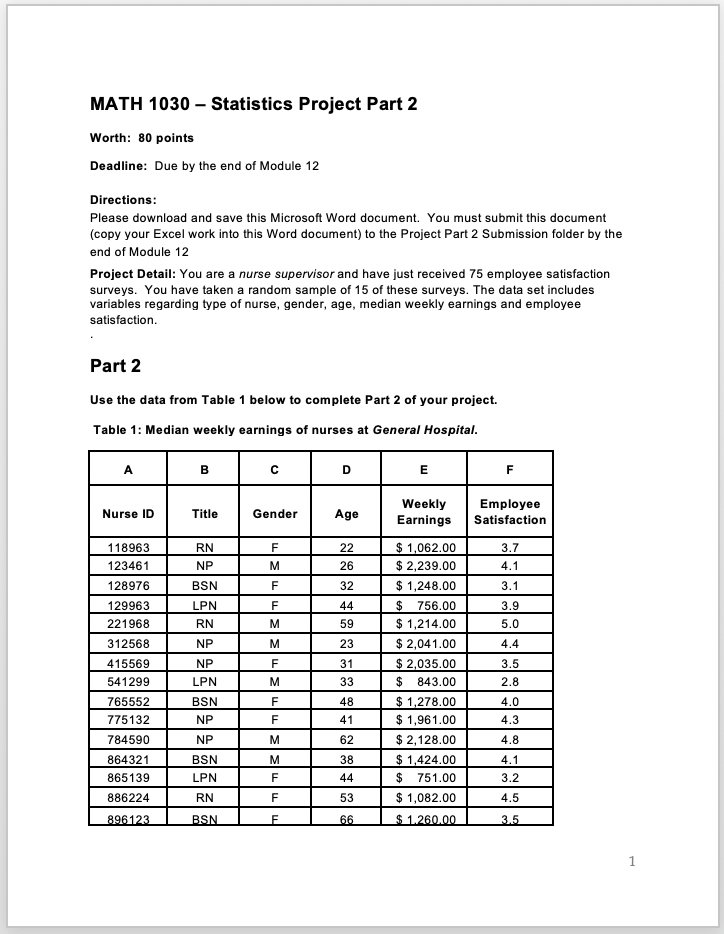

MATH 1030 - Statistics Project Part 2 Worth: 80 points Deadline: Due by the end of Module 12 Directions: Please download and save this Microsoft Word document. You must submit this document (copy your Excel work into this Word document) to the Project Part 2 Submission folder by the end of Module 12 Project Detail: You are a nurse supervisor and have just received 75 employee satisfaction surveys. You have taken a random sample of 15 of these surveys. The data set includes variables regarding type of nurse, gender, age, median weekly earnings and employee satisfaction. Part 2 Use the data from Table 1 below to complete Part 2 of your project. Table 1: Median weekly earnings of nurses at General Hospital. B D E F Weekly Employee Nurse ID Title Gender Age Earnings Satisfaction 118963 RN F 22 $ 1,062.00 3.7 23461 NP M 26 $ 2,239.00 4.1 128976 BSN F 32 $ 1,248.00 3.1 29963 PN F 44 $ 756.00 3.9 221968 RN M 59 $ 1,214.00 5.0 312568 NP M 23 $ 2,041.00 1.4 415569 VP F 31 $ 2,035.00 3.5 541295 _PN M 33 $ 843.00 2.8 765552 BSN F 48 $ 1,278.00 4.0 775132 NP F 41 $ 1,961.00 1.3 784590 VP M 62 $ 2,128.00 4.8 864321 BSN M 38 $ 1,424.00 4.1 865139 _PN 44 $ 751.00 3.2 38622 RN F 53 $ 1,082.00 1.5 896123 BSN F 66 $ 1.260.00 3.5 11. We want to determine which factors are associated with Employee Satisfaction. A. Create a scatterplot of Weekly Earnings and Employee Satisfaction. Paste your graph below. Make sure your graph has a proper title and axes labels. (See video link below if needed) B. Find the correlation coefficient of Weekly Earnings and Employee Satisfaction. Paste your correlation coefficient below. Interpret the direction and strength of the correlation coefficient. (See video link below if needed) C. Create a scatterplot of Age and Employee Satisfaction Paste your graph below. Make sure your graph has a proper title and axes labels. (See video link below if needed) D. Find the correlation coefficient of Age and Employee Satisfaction. Paste your correlation coefficient below. Interpret the direction and strength of the correlation coefficient. (See video link below if needed) E. Using your answers from part B and part D, is Weekly Earnings or Age more strongly correlated with Employee Satisfaction? F. Is this result what you would expect, why or why not? 2. Complete a regression analysis using Weekly Earnings (x variable) to predict Employee Satisfaction (y variable). Show all of your work. (See video link below if needed) A. Paste your regression analysis output below. B. Using the output in part A, write out the linear equation to predict Employee Satisfaction. C. Use your regression equation in part B to estimate the Employee Satisfaction of an employee who has an Weekly Earnings of $1,750. Show all of your work. 3. Using Table 1, find the probability that a nurse is male. 4. Using Table 1, find the probability that a female employee is in her fifties. 25. Use the age variable [Column (2} for males only and the i'olowhg frequency distribution to answer parts A and 8 below. Frequency Dislrlhutlon 20 29.5 A) Create a bar chart or histogram of the age data of the male employees. Make sure to Include a title on your graph and label each axis. Paste your graph below. (See video link below If needed} 3) Based on the shape of the bar chart or histogram in part A. does male age appear to follow a normal distribution? Why or why not? a. A survey of these same employees is taken on the average commute time to work. The mean and standard deviation oi'the survey are as follows: Mean commute time: all minutes standard deviation: in minutes A) Use the mean and standard deviation above to calculate the z-score of a 45 rnhute commute to work. 3] Explain what this z-seore tells us
Step by Step Solution
There are 3 Steps involved in it

Get step-by-step solutions from verified subject matter experts