

Question: Math 133: 4.1 Worksheet #2 Name: Section #: 4.1: Scatter Diagrams and Correlation 1. Suppose you were to collect data for the pair of variables

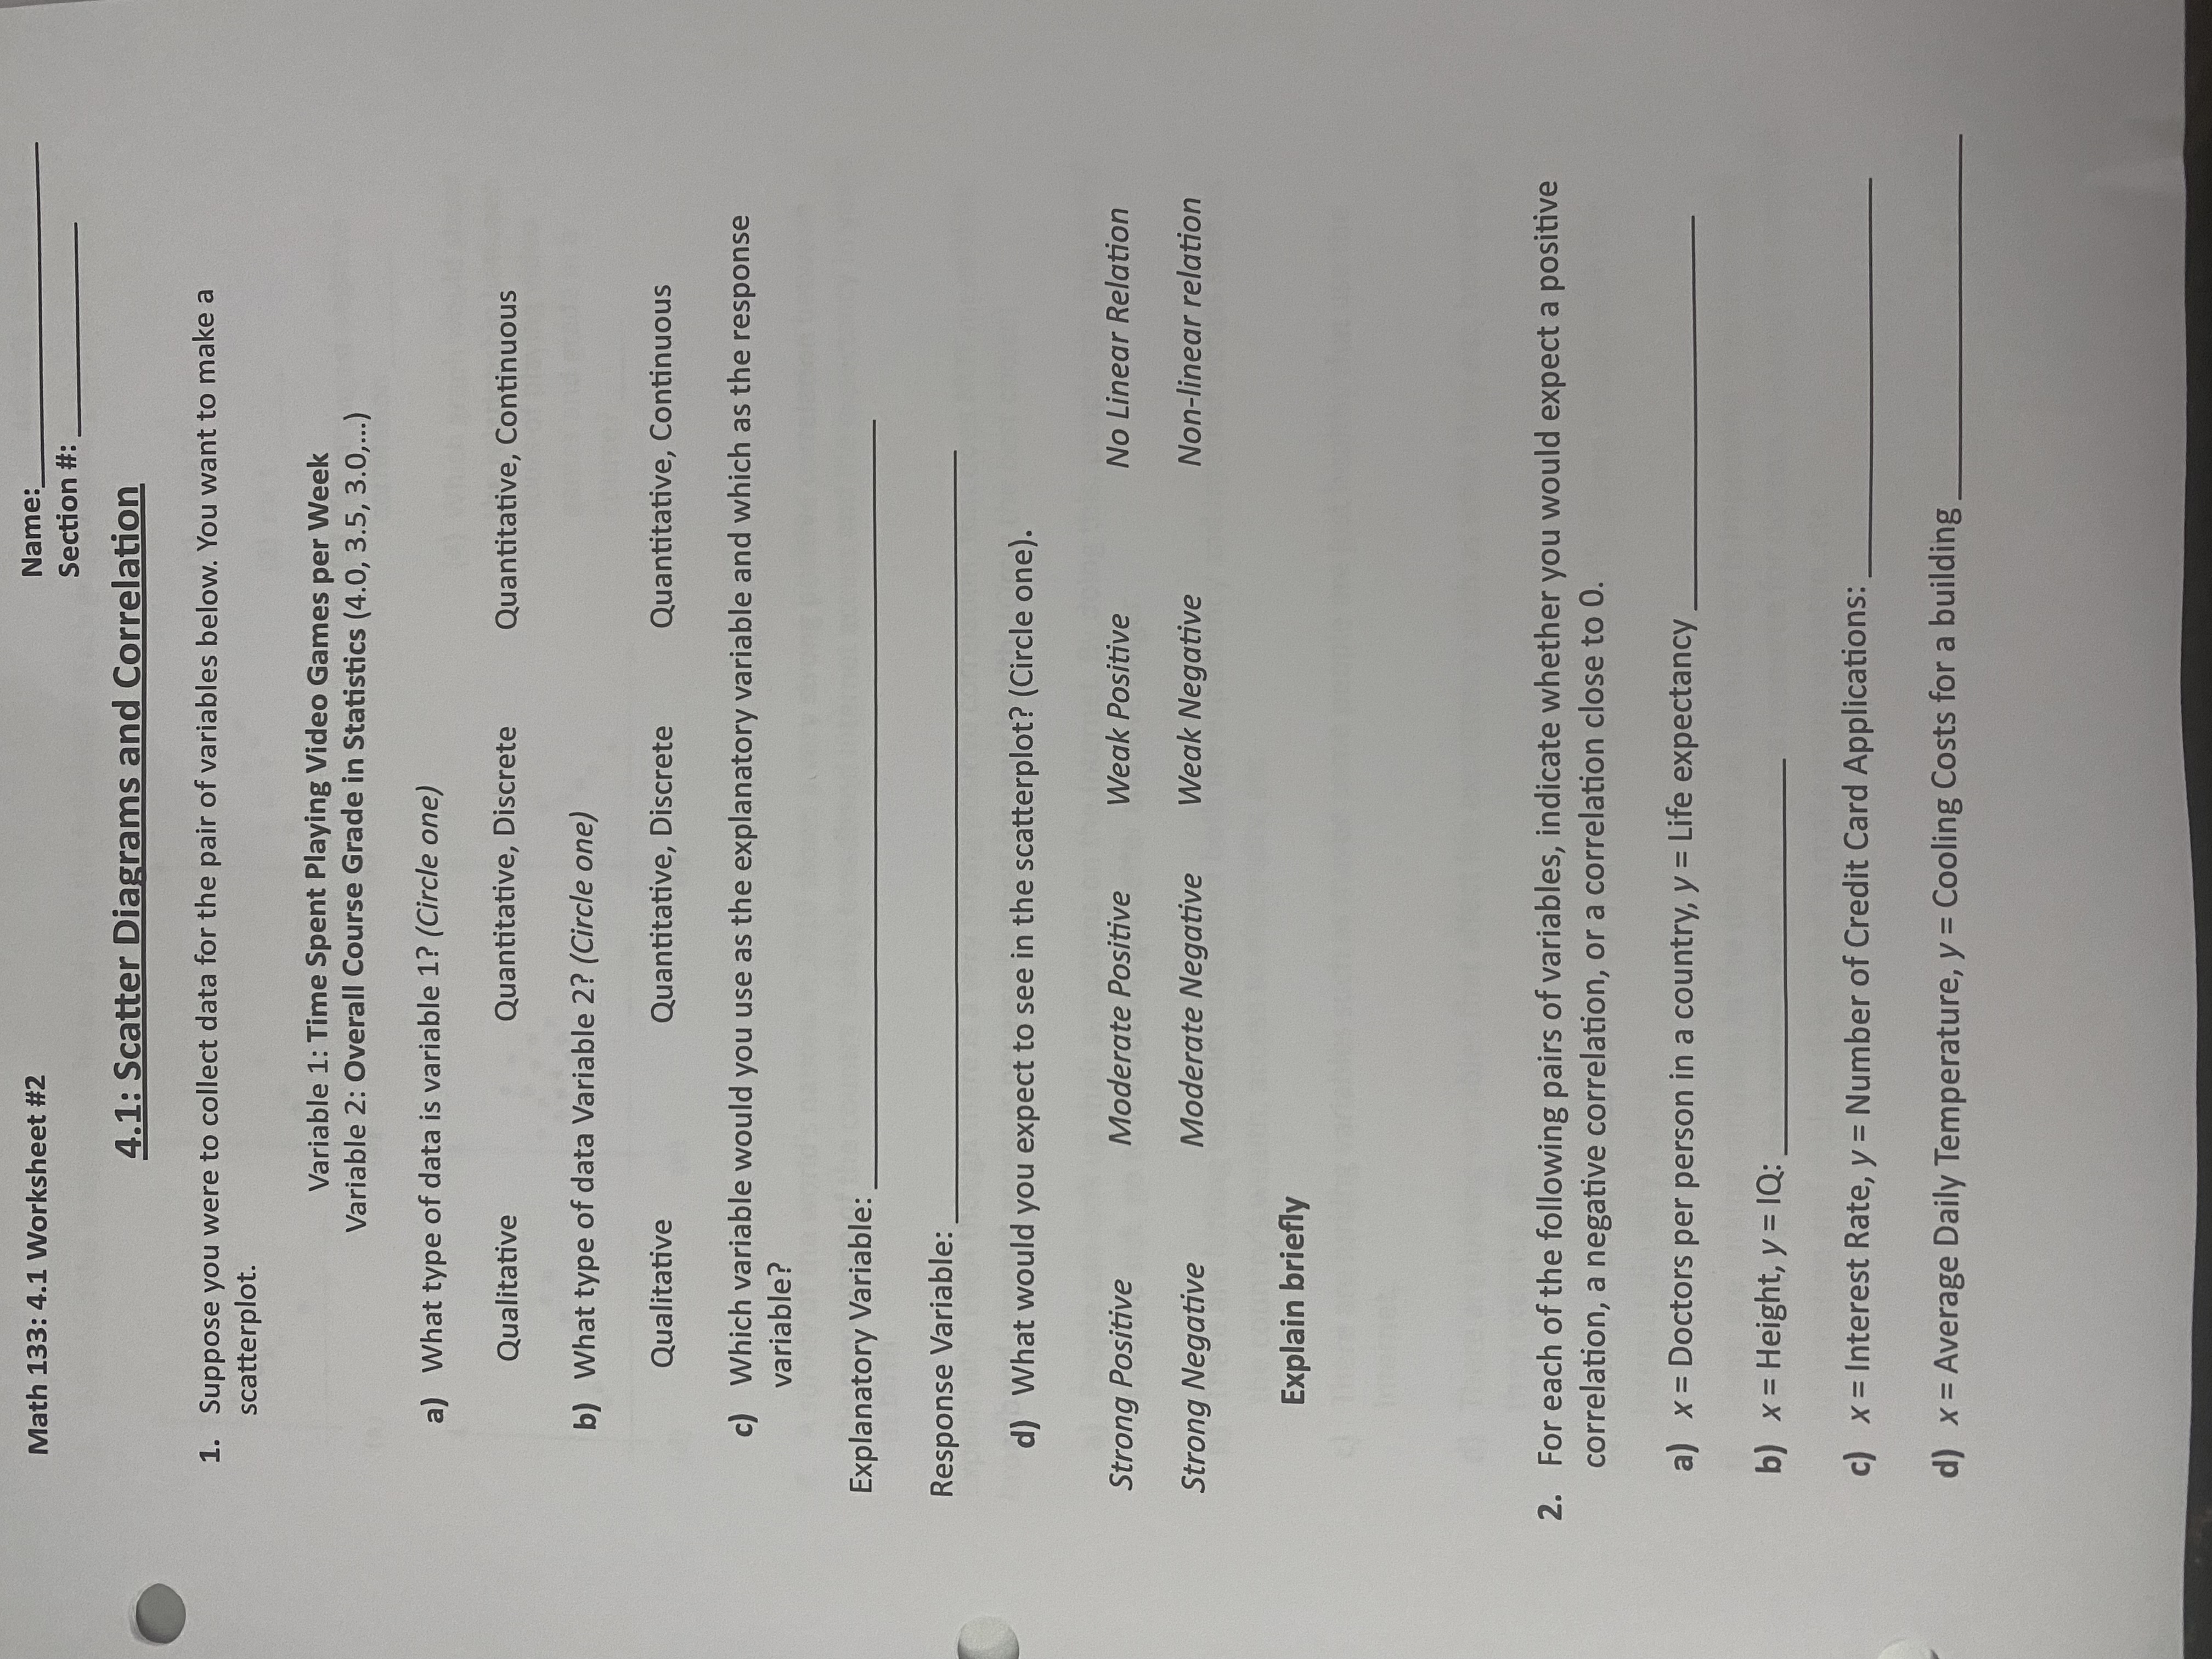
Math 133: 4.1 Worksheet #2 Name: Section #: 4.1: Scatter Diagrams and Correlation 1. Suppose you were to collect data for the pair of variables below. You want to make a scatterplot. Variable 1: Time Spent Playing Video Games per Week Variable 2: Overall Course Grade in Statistics (4.0, 3.5, 3.0,...) a) What type of data is variable 1? (Circle one) Qualitative Quantitative, Discrete Quantitative, Continuous b) What type of data Variable 2? (Circle one) Qualitative Quantitative, Discrete Quantitative, Continuous c) Which variable would you use as the explanatory variable and which as the response variable? Explanatory Variable: Response Variable: d) What would you expect to see in the scatterplot? (Circle one). Strong Positive Moderate Positive Weak Positive No Linear Relation Strong Negative Moderate Negative Weak Negative Non-linear relation Explain briefly 2. For each of the following pairs of variables, indicate whether you would expect a positive correlation, a negative correlation, or a correlation close to 0. a) x = Doctors per person in a country, y = Life expectancy b) x = Height, y = 1Q: c) x = Interest Rate, y = Number of Credit Card Applications: d) x = Average Daily Temperature, y = Cooling Costs for a building
Step by Step Solution
There are 3 Steps involved in it

Get step-by-step solutions from verified subject matter experts