

Question: Math 133: Ch 2 Review Worksheet Name: Section #: Ch 2 Review Worksheet 1. The following graph shows the demographic makeup, by race, of the
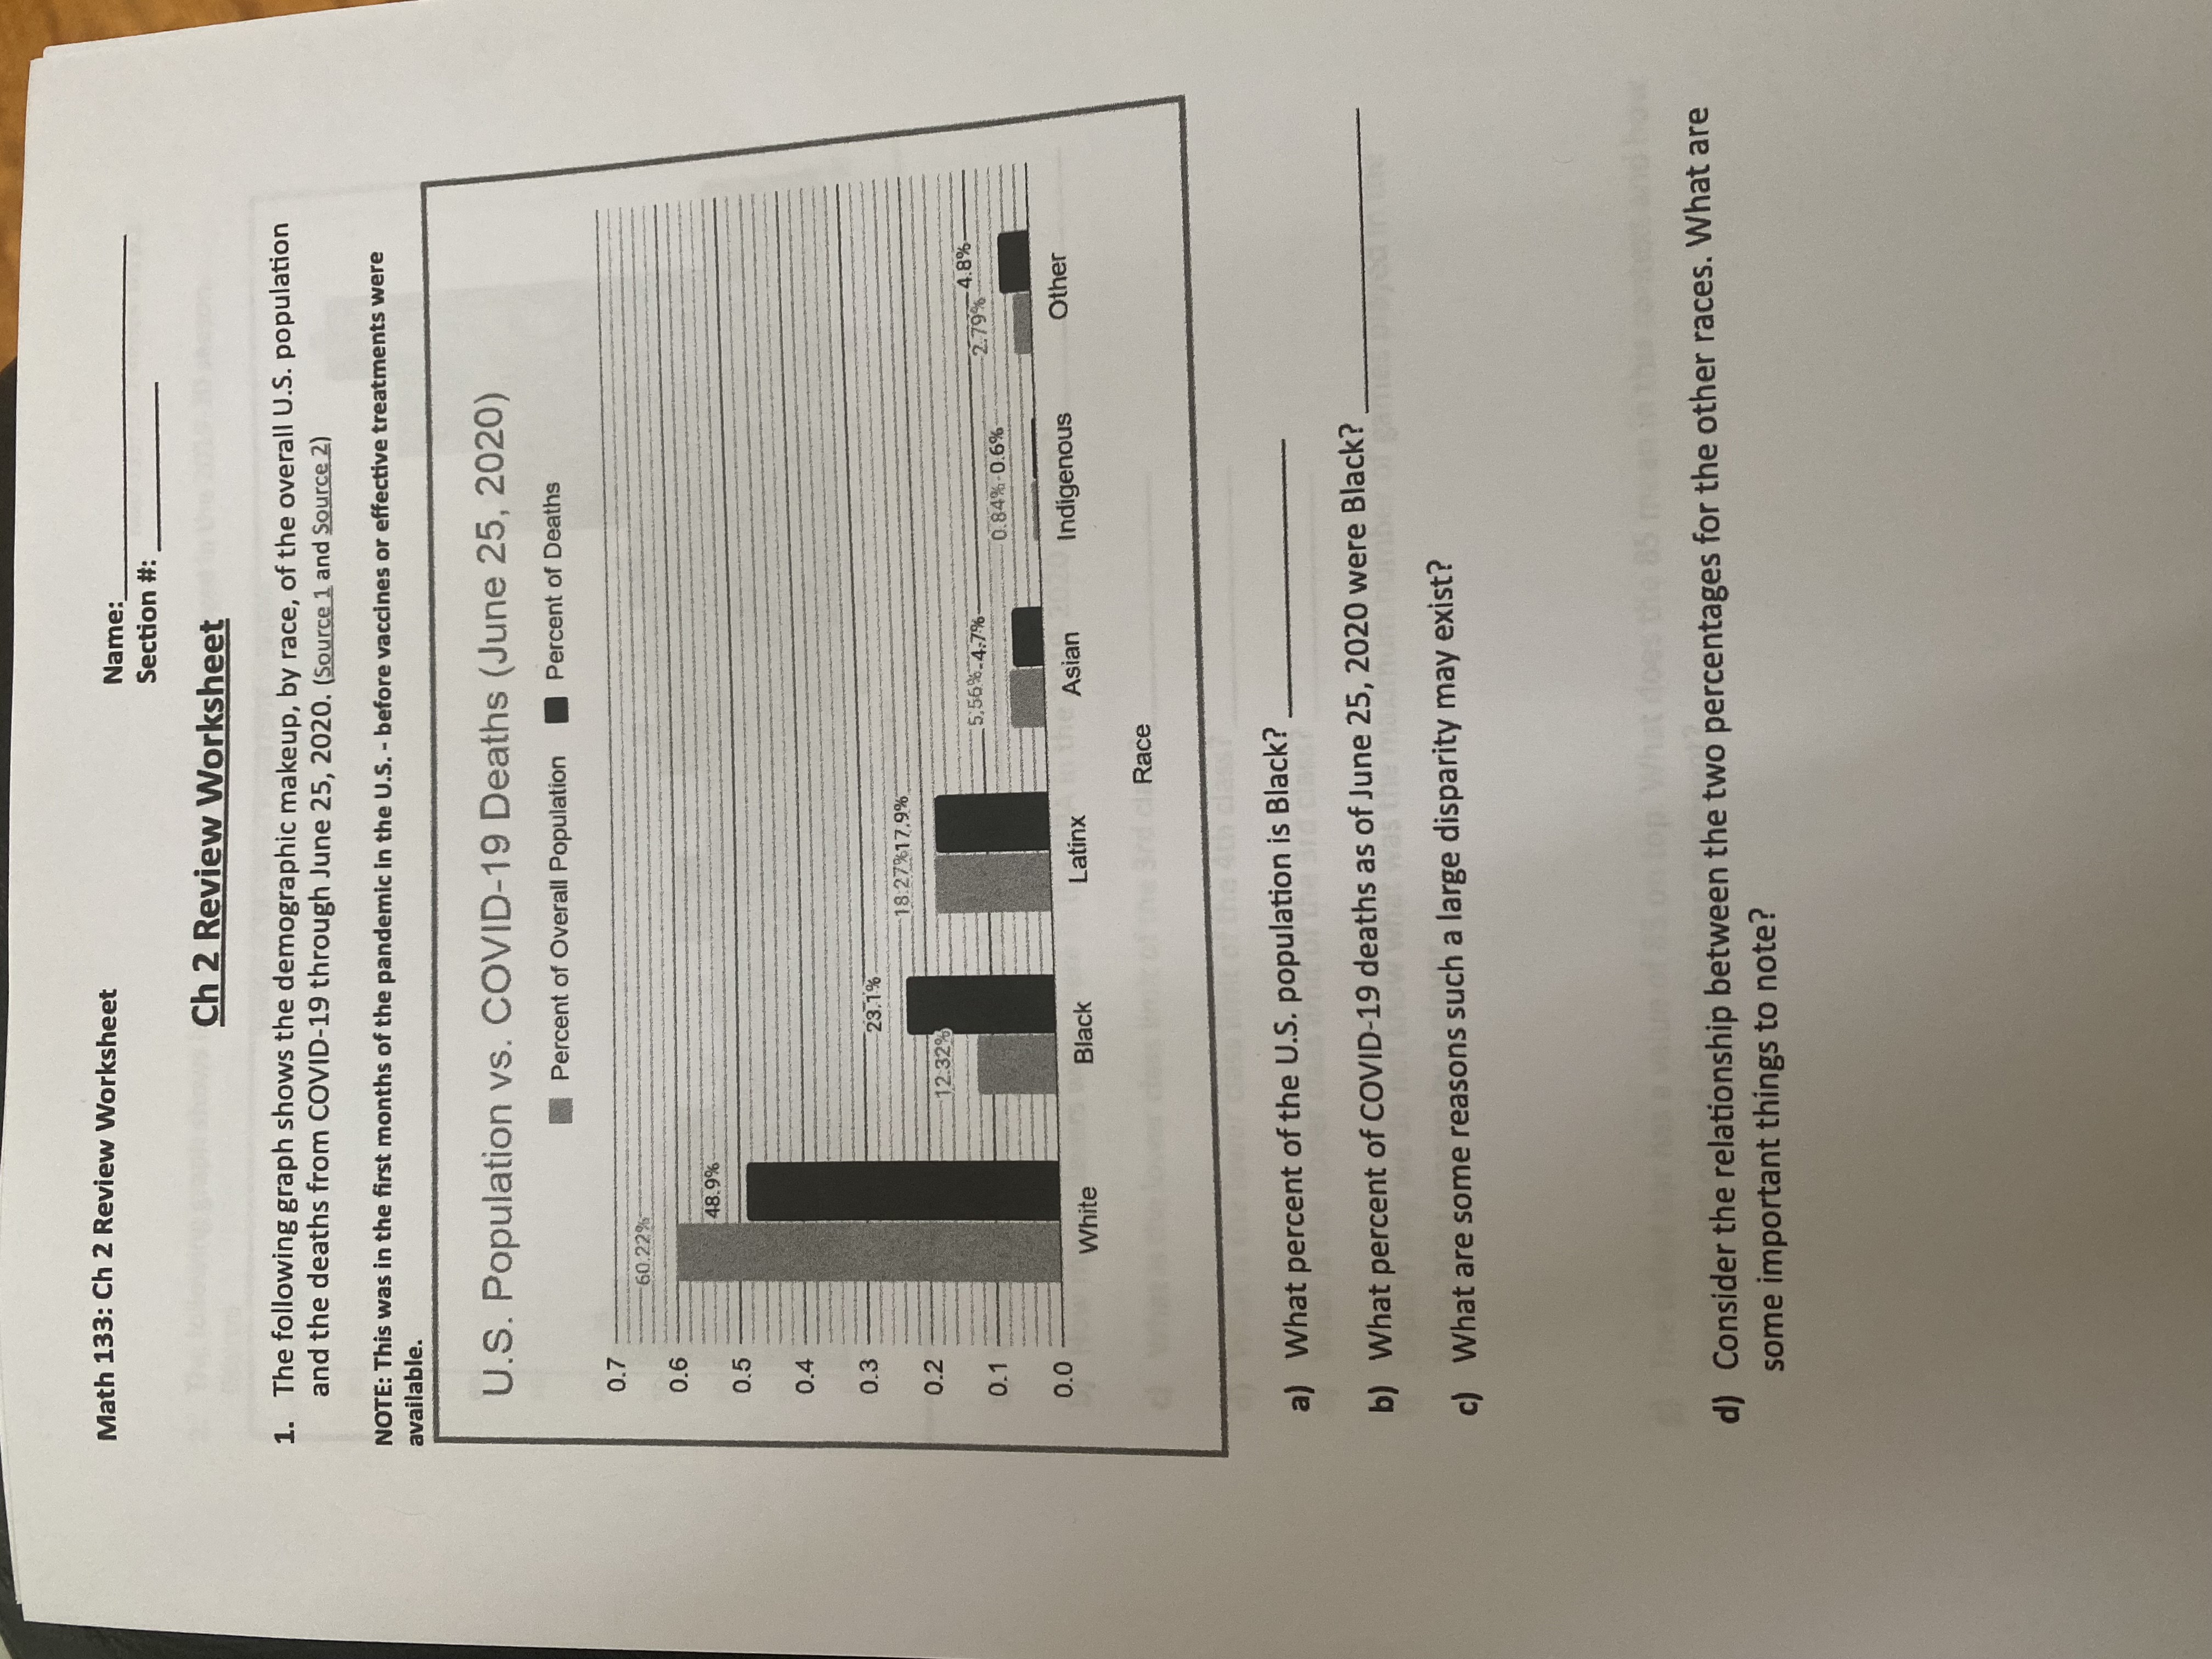
Math 133: Ch 2 Review Worksheet Name: Section #: Ch 2 Review Worksheet 1. The following graph shows the demographic makeup, by race, of the overall U.S. population and the deaths from COVID-19 through June 25, 2020. (Source 1 and Source 2) NOTE: This was in the first months of the pandemic in the U.S. - before vaccines or effective treatments were available. U.S. Population vs. COVID-19 Deaths (June 25, 2020) Percent of Overall Population Percent of Deaths 0.7 60.22% 0.6 48.9% 0.5 0.4 0.3 23.1%- 18:27%17.9% 0.2 -12.329 5,56%-4.7% -2.79% 4.8% 0.1 0.84% -0.6% - 0.0 Asian Indigenous Other White Black Latinx Race a) What percent of the U.S. population is Black? b) What percent of COVID-19 deaths as of June 25, 2020 were Black? c) What are some reasons such a large disparity may exist? d) Consider the relationship between the two percentages for the other races. What are some important things to
Step by Step Solution
There are 3 Steps involved in it

Get step-by-step solutions from verified subject matter experts