

Question: Math 1342 Homework Section 2.2 1) Consider the following data set. 4 15 10 8 33 25 36 40 36 66 6 63 50 64
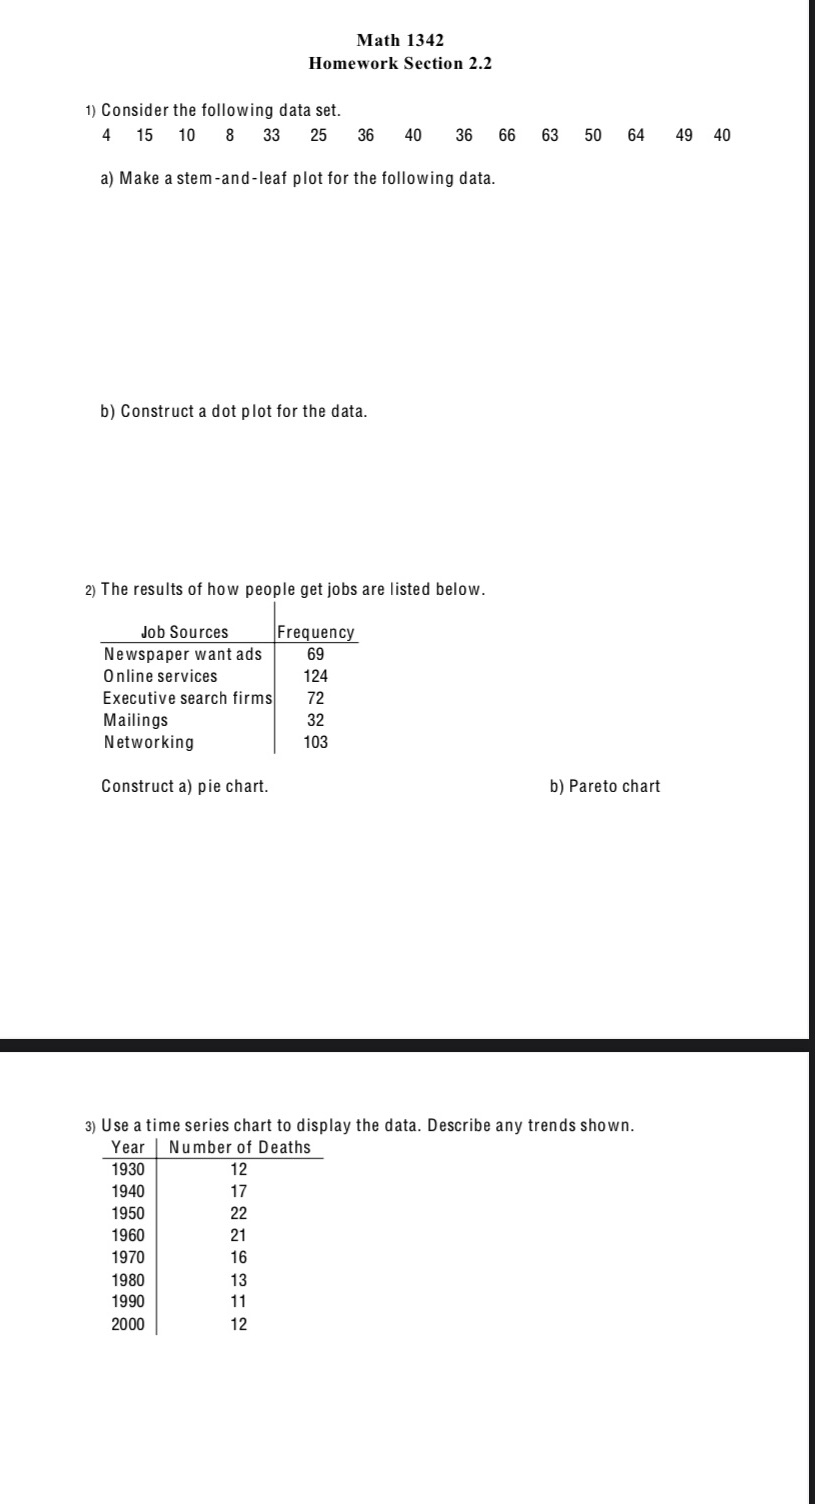
Math 1342 Homework Section 2.2 1) Consider the following data set. 4 15 10 8 33 25 36 40 36 66 6 63 50 64 49 40 a) Make a stem-and-leaf plot for the following data. b) Construct a dot plot for the data. 2) The results of how people get jobs are listed below. Job Sources Frequency Newspaper want ads 69 Online services 124 Executive search firms 72 Mailings 32 Networking 103 Construct a) pie chart. b) Pareto chart 3) Use a time series chart to display the data. Describe any trends shown. Year Number of Deaths 1930 12 1940 17 1950 22 1960 21 1970 16 1980 13 1990 11 2000 12
Step by Step Solution
There are 3 Steps involved in it
1 Expert Approved Answer
Step: 1 Unlock

Question Has Been Solved by an Expert!
Get step-by-step solutions from verified subject matter experts
Step: 2 Unlock
Step: 3 Unlock