

Question: MATH 1342 Name Elementary Statistical Methods Lab Ch.2 - Frequency Distributions and Graphs Critical Thinking; Communication Skills; Empirical/Quantitative Skills This lab involves making an informed

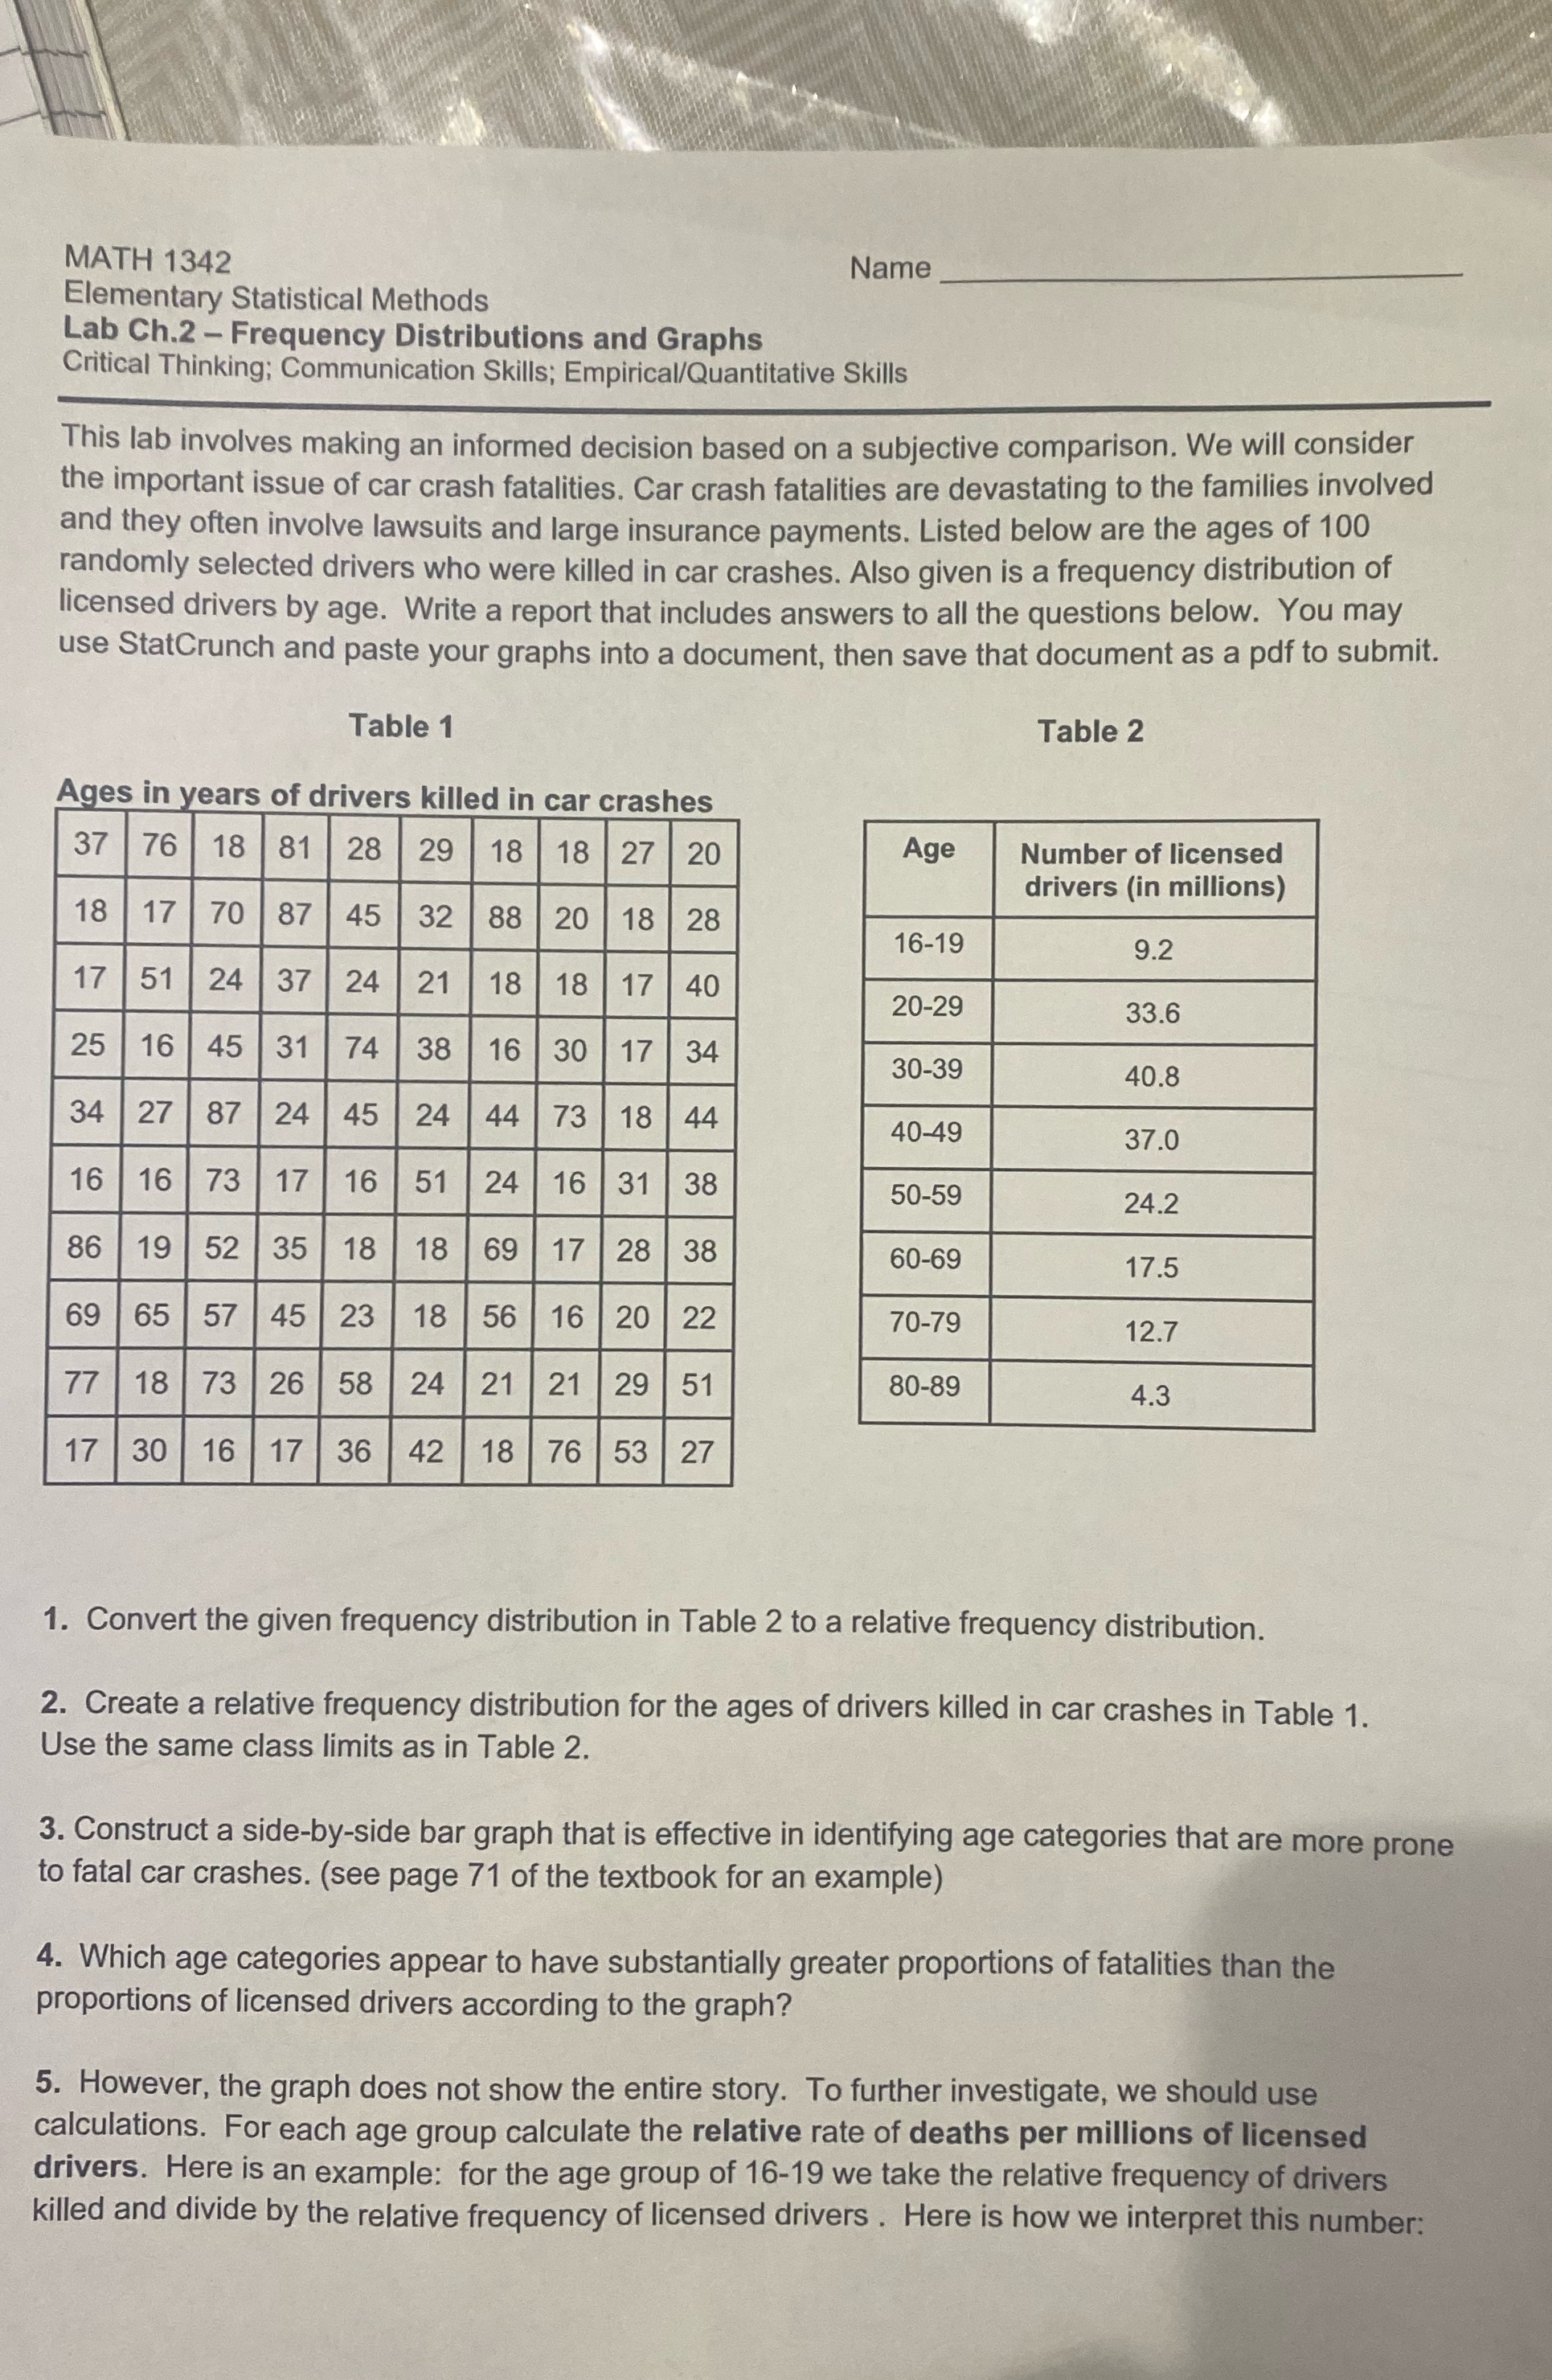
MATH 1342 Name Elementary Statistical Methods Lab Ch.2 - Frequency Distributions and Graphs Critical Thinking; Communication Skills; Empirical/Quantitative Skills This lab involves making an informed decision based on a subjective comparison. We will consider the important issue of car crash fatalities. Car crash fatalities are devastating to the families involved and they often involve lawsuits and large insurance payments. Listed below are the ages of 100 randomly selected drivers who were killed in car crashes. Also given is a frequency distribution of licensed drivers by age. Write a report that includes answers to all the questions below. You may use StatCrunch and paste your graphs into a document, then save that document as a pdf to submit. Table 1 Table 2 Ages in years of drivers killed in car crashes 37 76 18 81 28 29 18 18 27 20 Age Number of licensed drivers (in millions) 18 17 70 87 45 32 88 20 18 28 16-19 9.2 24 37 24 21 18 18 17 40 20-29 33.6 25 16 45 31 74 38 16 30 17 34 30-39 40.8 34 27 87 24 45 24 44 73 18 44 40-49 37.0 16 16 73 16 51 24 16 31 38 50-59 24.2 86 19 52 35 18 18 69 17 28 38 60-69 17.5 69 65 57 15 23 18 56 16 20 22 70-79 12.7 77 18 73 26 58 24 21 21 29 51 80-89 4.3 17 30 16 17 36 42 18 76 53 27 1. Convert the given frequency distribution in Table 2 to a relative frequency distribution. 2. Create a relative frequency distribution for the ages of drivers killed in car crashes in Table 1. Use the same class limits as in Table 2. 3. Construct a side-by-side bar graph that is effective in identifying age categories that are more prone to fatal car crashes. (see page 71 of the textbook for an example) 4. Which age categories appear to have substantially greater proportions of fatalities than the proportions of licensed drivers according to the graph? 5. However, the graph does not show the entire story. To further investigate, we should use calculations. For each age group calculate the relative rate of deaths per millions of licensed drivers. Here is an example: for the age group of 16-19 we take the relative frequency of drivers killed and divide by the relative frequency of licensed drivers . Here is how we interpret this number
Step by Step Solution
There are 3 Steps involved in it

Get step-by-step solutions from verified subject matter experts