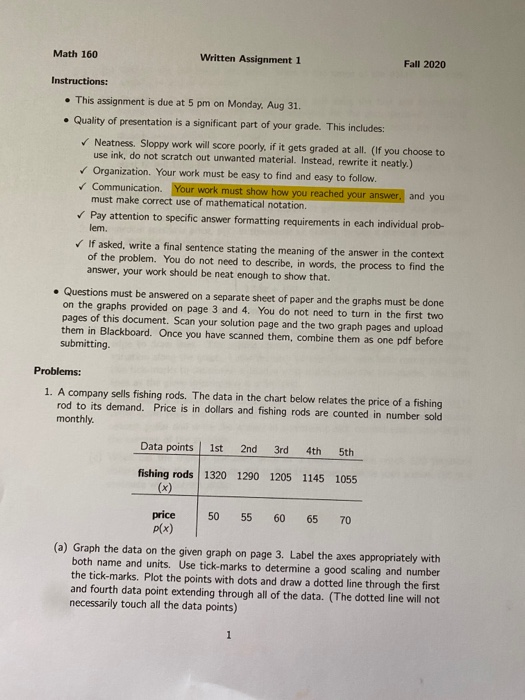
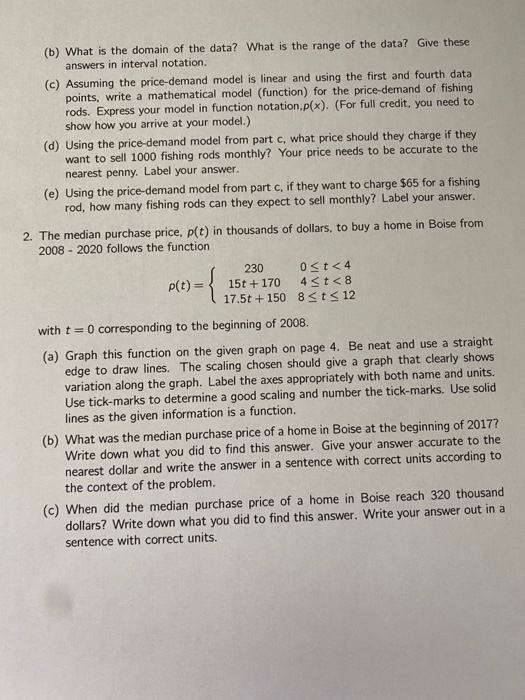
Question: Math 160 Written Assignment 1 Fall 2020 Instructions: This assignment is due at 5 pm on Monday, Aug 31. . Quality of presentation is a

Math 160 Written Assignment 1 Fall 2020
Math 160 Written Assignment 1 Fall 2020 Instructions: This assignment is due at 5 pm on Monday, Aug 31. . Quality of presentation is a significant part of your grade. This includes: Neatness. Sloppy work will score poorly, if it gets graded at all. (If you choose to use ink, do not scratch out unwanted material. Instead, rewrite it neatly.) Organization. Your work must be easy to find and easy to follow. Communication. Your work must show how you reached your answer, and you must make correct use of mathematical notation. Pay attention to specific answer formatting requirements in each individual prob- lem. If asked, write a final sentence stating the meaning of the answer in the context of the problem. You do not need to describe, in words, the process to find the answer, your work should be neat enough to show that. Questions must be answered on a separate sheet of paper and the graphs must be done on the graphs provided on page 3 and 4. You do not need to turn in the first two pages of this document. Scan your solution page and the two graph pages and upload them in Blackboard. Once you have scanned them, combine them as one pdf before submitting. Problems: 1. A company sells fishing rods. The data in the chart below relates the price of a fishing rod to its demand. Price is in dollars and fishing rods are counted in number sold monthly. Data points 1st 2nd 3rd 4th 5th fishing rods 1320 1290 1205 1145 1055 price 50 55 60 65 70 p(x) (a) Graph the data on the given graph on page 3. Label the axes appropriately with both name and units. Use tick-marks to determine a good scaling and number the tick-marks. Plot the points with dots and draw a dotted line through the first and fourth data point extending through all of the data. (The dotted line will not necessarily touch all the data points) 1 (b) What is the domain of the data? What is the range of the data? Give these answers in interval notation. (c) Assuming the price-demand model is linear and using the first and fourth data points, write a mathematical model (function) for the price-demand of fishing rods. Express your model in function notation.p(x). (For full credit, you need to show how you arrive at your model.) (d) Using the price-demand model from part c, what price should they charge if they want to sell 1000 fishing rods monthly? Your price needs to be accurate to the nearest penny. Label your answer. (e) Using the price-demand model from part c, if they want to charge $65 for a fishing rod, how many fishing rods can they expect to sell monthly? Label your answer. 2. The median purchase price. p(t) in thousands of dollars, to buy a home in Boise from 2008 - 2020 follows the function 230 Ost

Step by Step Solution

There are 3 Steps involved in it

1 Expert Approved Answer
Step: 1 Unlock blur-text-image
Question Has Been Solved by an Expert!

Get step-by-step solutions from verified subject matter experts

Step: 2 Unlock
Step: 3 Unlock

Students Have Also Explored These Related General Management Questions!