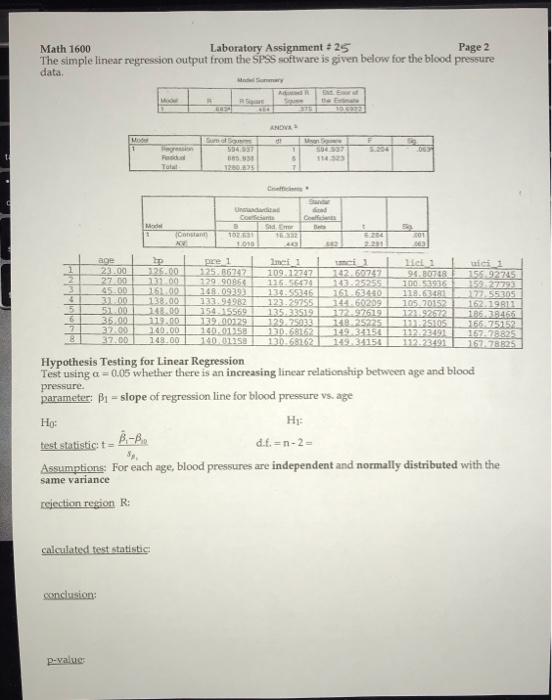
Question: Math 1600 Laboratory Assignment 25 Page 2 The simple linear regression output from the SPSS software is given below for the blood pressure data NE

Math 1600 Laboratory Assignment 25 Page 2 The
Math 1600 Laboratory Assignment 25 Page 2 The simple linear regression output from the SPSS software is given below for the blood pressure data NE M grem 1 OG 40 16.30 23 Com M 1 AU age pre 1 Le 1 1 23.00 125400 25.6227 109122:47 142.60747 94 BOTER 155977 27.00 231.00 12990854 222525 10092935 1572 45.00 151.90 2400929 1305945 164.53.450 12255305 5 33200 138.00 123494982 123.29755 14460209 5 105.2015 152.19812 51.00 248600 250115569 13543359 107297612 123.9272 1862466 35,00 139400229 129.25933 B25225 500S 6575319 37200 140.00 10020158 DLY 14034110 11223491 157832 3710D 148.00 100USB 119234154 15223492 151177832S Hypothesis Testing for Linear Regression Test using a 0.05 whether there is an increasing linear relationship between age and blood pressure. parameter: B1 - slope of regression line for blood pressure vs. age Ho: test statistic to d..=n-2- 8 Assumptions: For each age, blood pressures are independent and normally distributed with the same variance reiection region R: calculated test statistic cxclusion p-value Page 3 Math 1600 Laboratory Assignment ? 25 Confidence Intervals for Linear Regression Estimate of mean blood pressure for subjects of age 45 (245) 95% confidence interval for mean blood pressure for subjects of age 45 Predicted blood pressure for a subject of age 36 (x-36) = + AX- 95% confidence interval for the blood pressure of a subject of age 36 = Correlation sample correlation coefficient = = sample coefficient of determination =12 Question: What percentage of the variability in blood pressure in the data may be explained by the linear regression on age? Math 1600 Laboratory Assignment 25 Page 2 The simple linear regression output from the SPSS software is given below for the blood pressure data NE M grem 1 OG 40 16.30 23 Com M 1 AU age pre 1 Le 1 1 23.00 125400 25.6227 109122:47 142.60747 94 BOTER 155977 27.00 231.00 12990854 222525 10092935 1572 45.00 151.90 2400929 1305945 164.53.450 12255305 5 33200 138.00 123494982 123.29755 14460209 5 105.2015 152.19812 51.00 248600 250115569 13543359 107297612 123.9272 1862466 35,00 139400229 129.25933 B25225 500S 6575319 37200 140.00 10020158 DLY 14034110 11223491 157832 3710D 148.00 100USB 119234154 15223492 151177832S Hypothesis Testing for Linear Regression Test using a 0.05 whether there is an increasing linear relationship between age and blood pressure. parameter: B1 - slope of regression line for blood pressure vs. age Ho: test statistic to d..=n-2- 8 Assumptions: For each age, blood pressures are independent and normally distributed with the same variance reiection region R: calculated test statistic cxclusion p-value Page 3 Math 1600 Laboratory Assignment ? 25 Confidence Intervals for Linear Regression Estimate of mean blood pressure for subjects of age 45 (245) 95% confidence interval for mean blood pressure for subjects of age 45 Predicted blood pressure for a subject of age 36 (x-36) = + AX- 95% confidence interval for the blood pressure of a subject of age 36 = Correlation sample correlation coefficient = = sample coefficient of determination =12 Question: What percentage of the variability in blood pressure in the data may be explained by the linear regression on age

Step by Step Solution

There are 3 Steps involved in it

1 Expert Approved Answer
Step: 1 Unlock blur-text-image
Question Has Been Solved by an Expert!

Get step-by-step solutions from verified subject matter experts

Step: 2 Unlock
Step: 3 Unlock

Students Have Also Explored These Related General Management Questions!