

Question: math 1p98 Using the weights (Ib) and highway fuel consumption amounts (mi/gal) of the 48 cars listed in the accompanying data set, one gets this
math 1p98
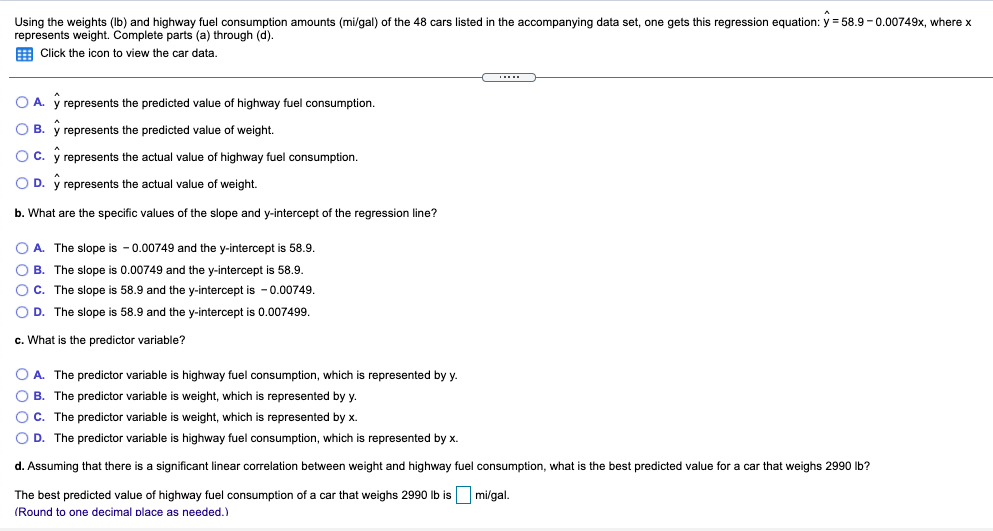
Using the weights (Ib) and highway fuel consumption amounts (mi/gal) of the 48 cars listed in the accompanying data set, one gets this regression equation: y = 58.9 -0.00749x, where x represents weight. Complete parts (a) through (d). Click the icon to view the car data. O A. y represents the predicted value of highway fuel consumption. O B. y represents the predicted value of weight. O C. y represents the actual value of highway fuel consumption. O D. y represents the actual value of weight. b. What are the specific values of the slope and y-intercept of the regression line? O A. The slope is - 0.00749 and the y-intercept is 58.9. O B. The slope is 0.00749 and the y-intercept is 58.9. O C. The slope is 58.9 and the y-intercept is - 0.00749. O D. The slope is 58.9 and the y-intercept is 0.007499. c. What is the predictor variable? O A. The predictor variable is highway fuel consumption, which is represented by y. O B. The predictor variable is weight, which is represented by y. O C. The predictor variable is weight, which is represented by x. O D. The predictor variable is highway fuel consumption, which is represented by x. d. Assuming that there is a significant linear correlation between weight and highway fuel consumption, what is the best predicted value for a car that weighs 2990 lb? The best predicted value of highway fuel consumption of a car that weighs 2990 lb is mi/gal. (Round to one decimal place as needed.)
Step by Step Solution
There are 3 Steps involved in it

Get step-by-step solutions from verified subject matter experts