

Question: math 210 prof: Samir Mansur assignment 2 4. In a research project to determine the relationship between the number of test review problems solved and

math 210
prof: Samir Mansur
assignment 2
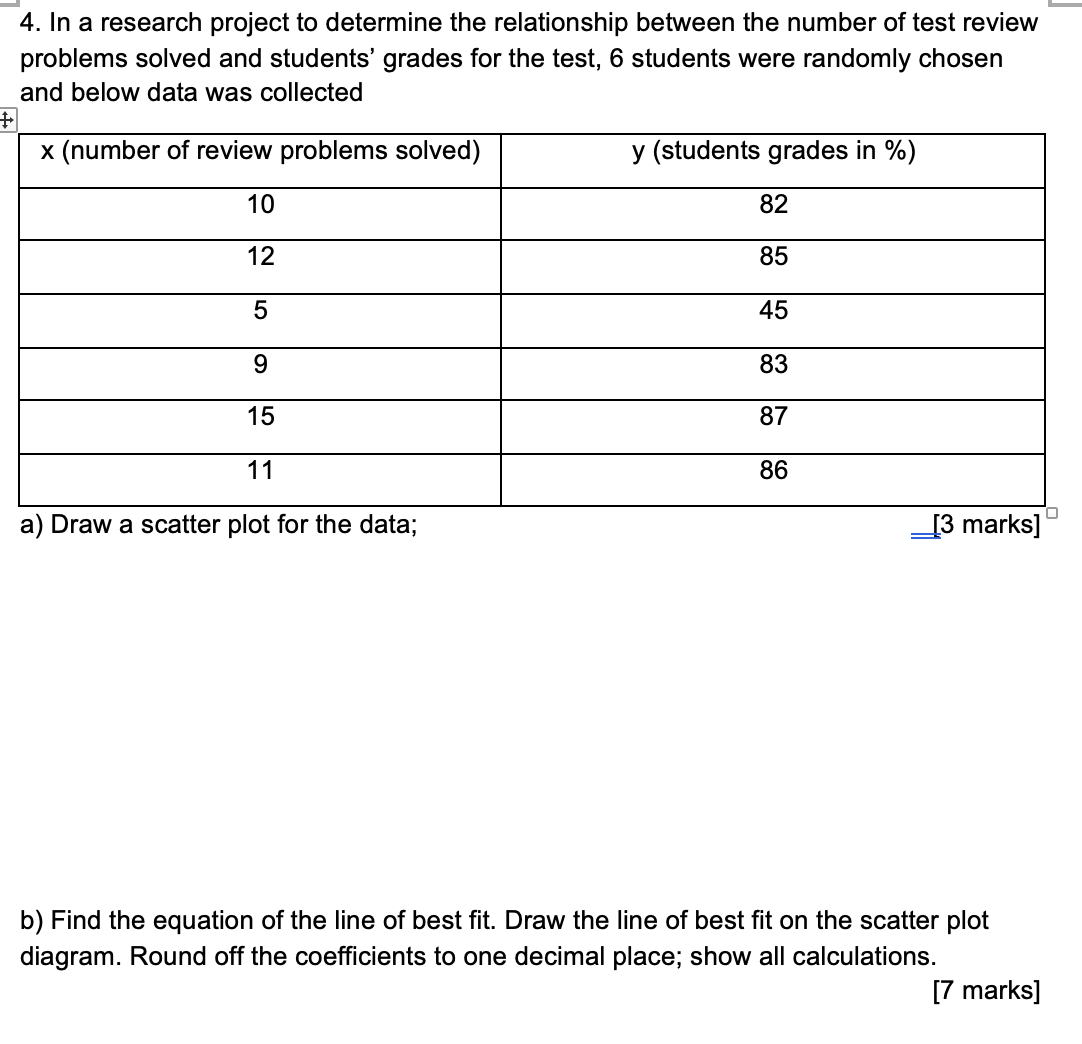
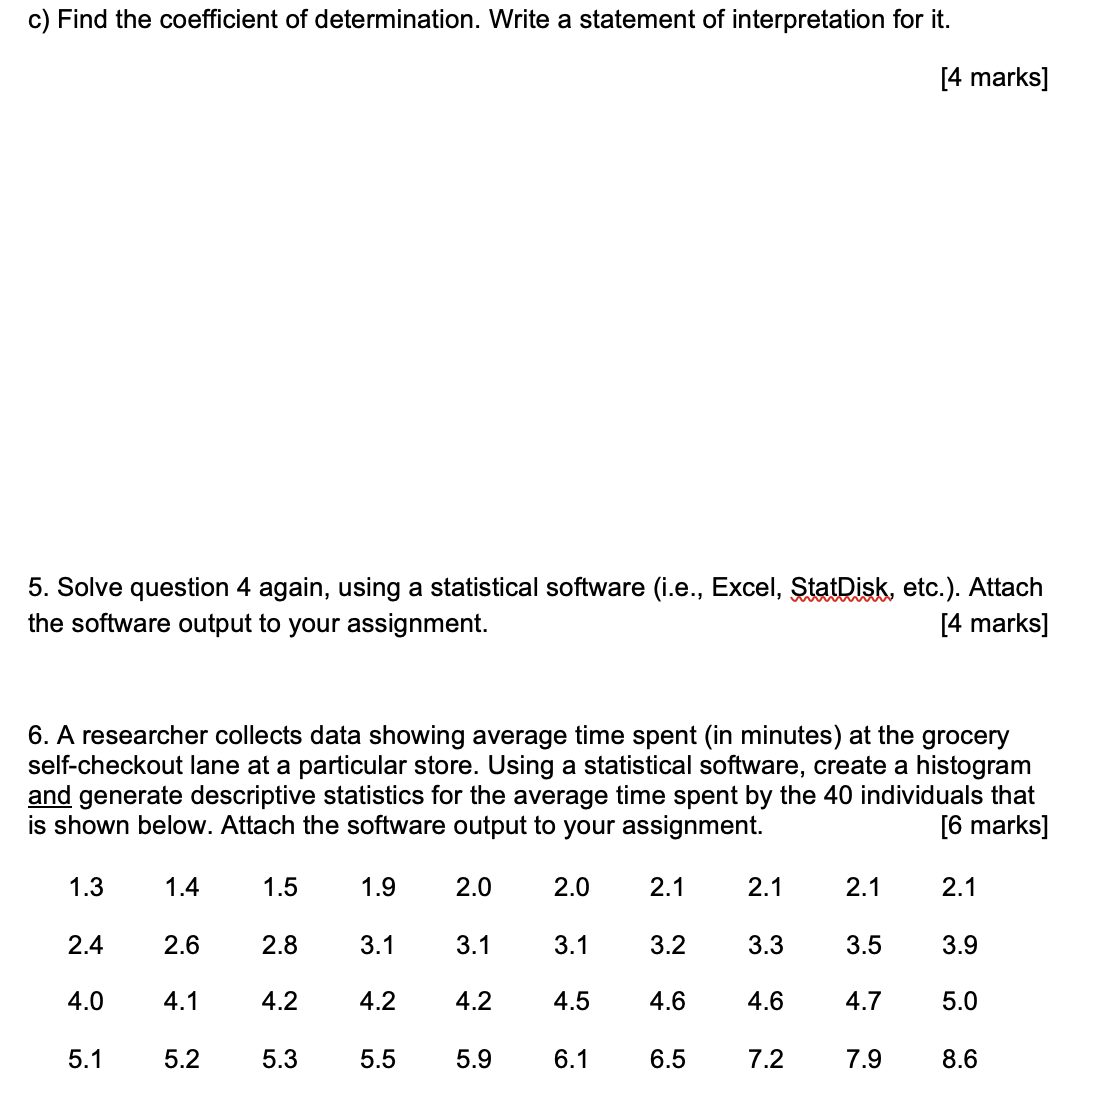
4. In a research project to determine the relationship between the number of test review problems solved and students' grades for the test, 6 students were randomly chosen and below data was collected x (number of review problems solved) y (students grades in %) 10 82 12 85 5 45 9 83 15 87 11 86 a) Draw a scatter plot for the data; [3 marks] b) Find the equation of the line of best fit. Draw the line of best fit on the scatter plot diagram. Round off the coefficients to one decimal place; show all calculations. [7 marks]c) Find the coefficient of determination. Write a statement of interpretation for it. [4 marks] 5. Solve question 4 again, using a statistical software (i.e., Excel, W etc.). Attach the software output to your assignment. [4 marks] 6. A researcher collects data showing average time spent (in minutes) at the grocery self-checkout lane at a particular store. Using a statistical software, create a histogram m generate descriptive statistics for the average time spent by the 40 individuals that is shown below. Attach the software output to your assignment. [6 marks] 1.3 1.4 1.5 1.9 2.0 2.0 2.1 2.1 2.1 2.1 2.4 2.6 2.8 3.1 3.1 3.1 3.2 3.3 3.5 3.9 4.0 4.1 4.2 4.2 4.2 4.5 4.6 4.6 4.7 5.0 5.1 5.2 5.3 5.5 5.9 6.1 6.5 7.2 7.9 8.6
Step by Step Solution
There are 3 Steps involved in it

Get step-by-step solutions from verified subject matter experts