

Question: Math 215 Statistical Concepts 1. 5. A. Is this a test for a difference in two population proportions or two population means? If two population
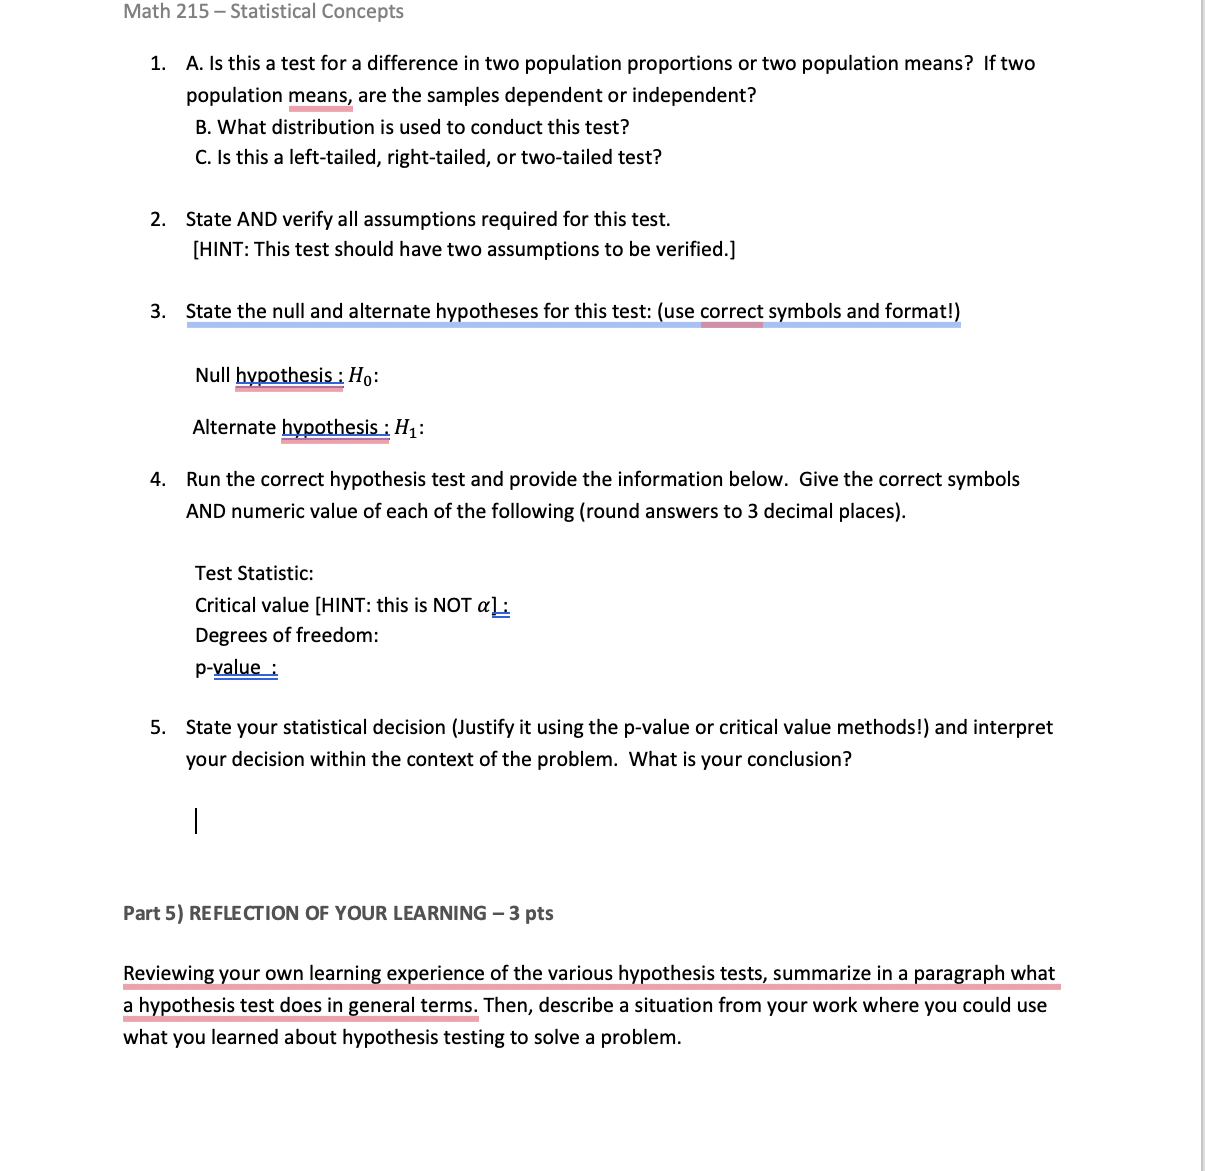
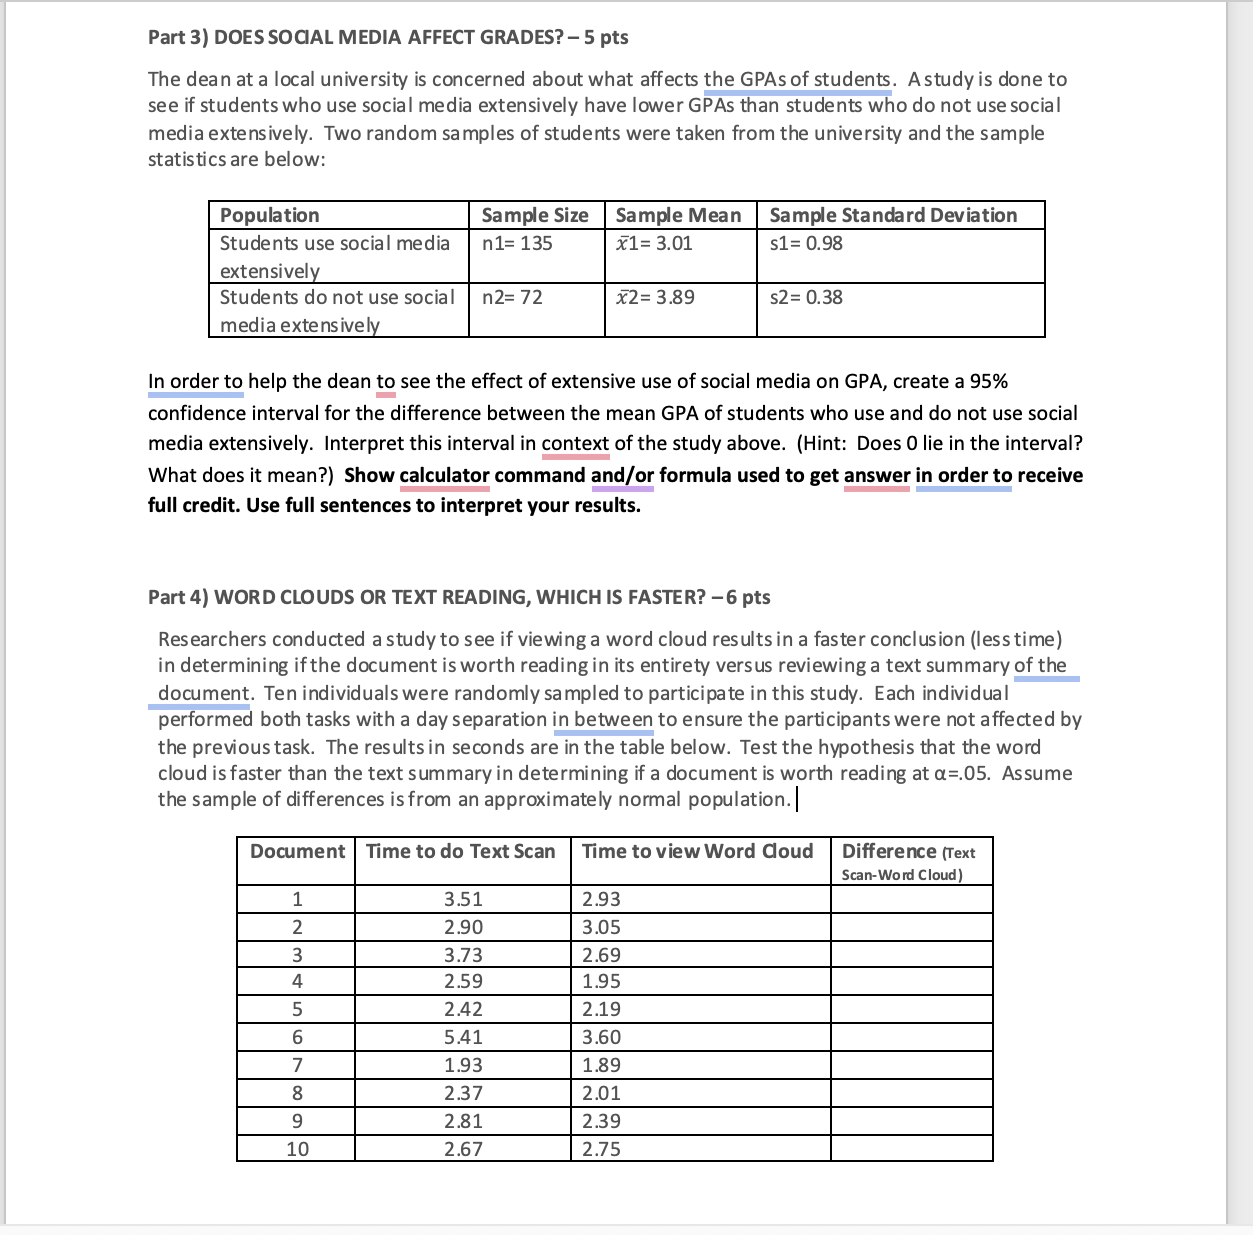
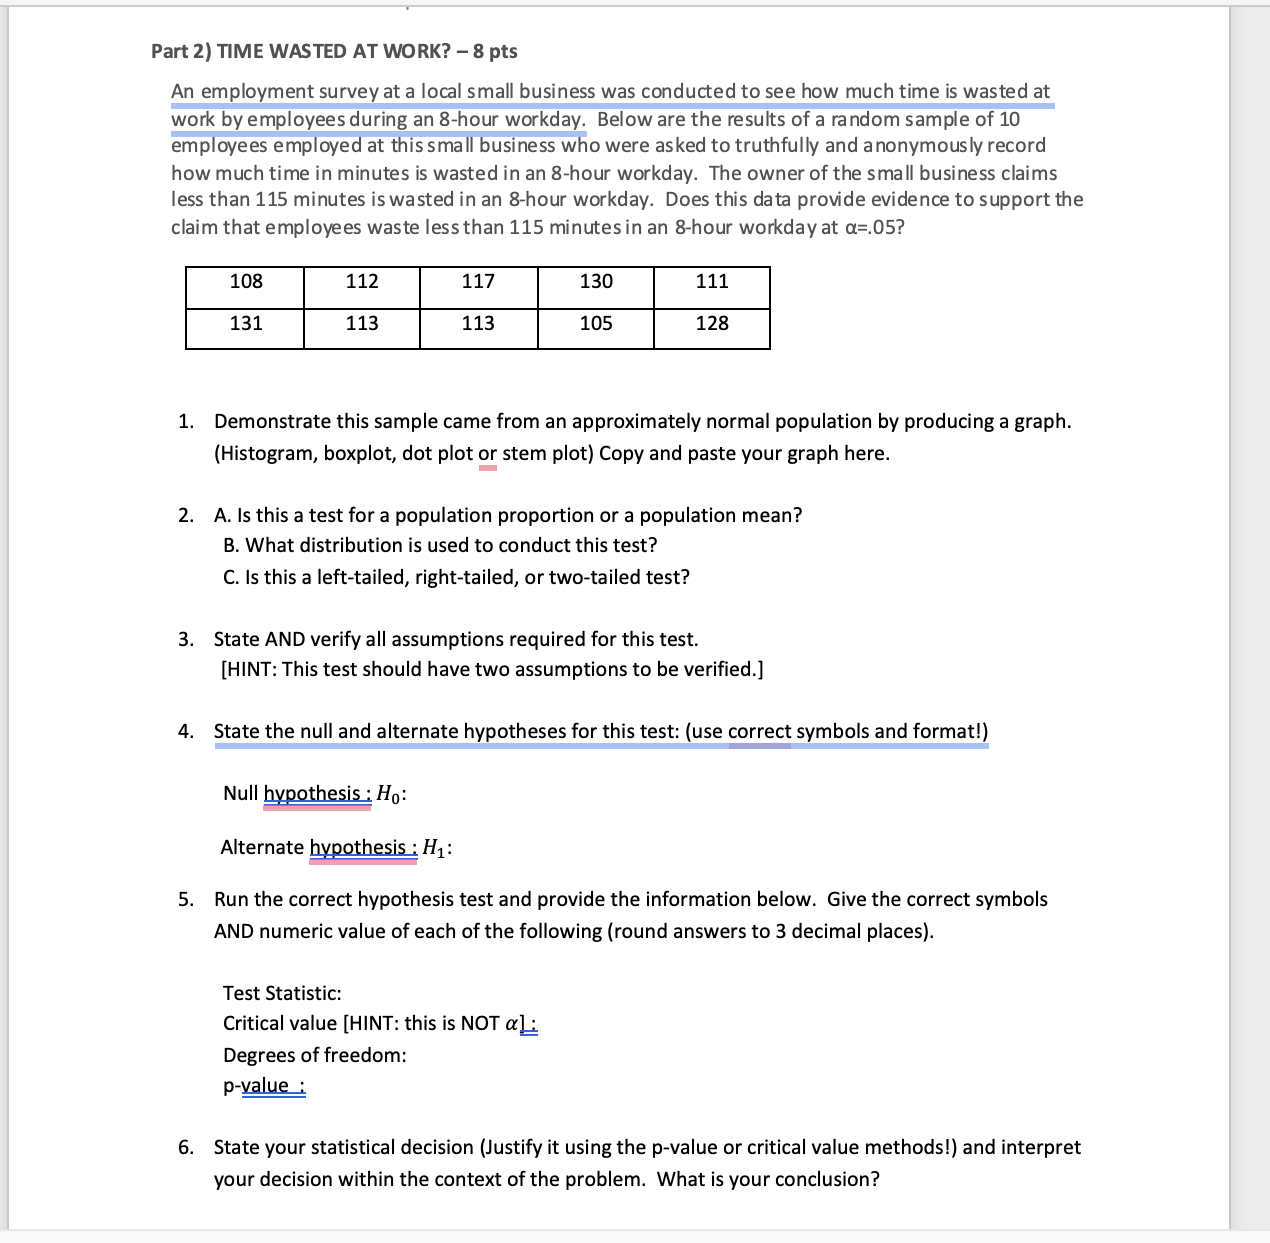
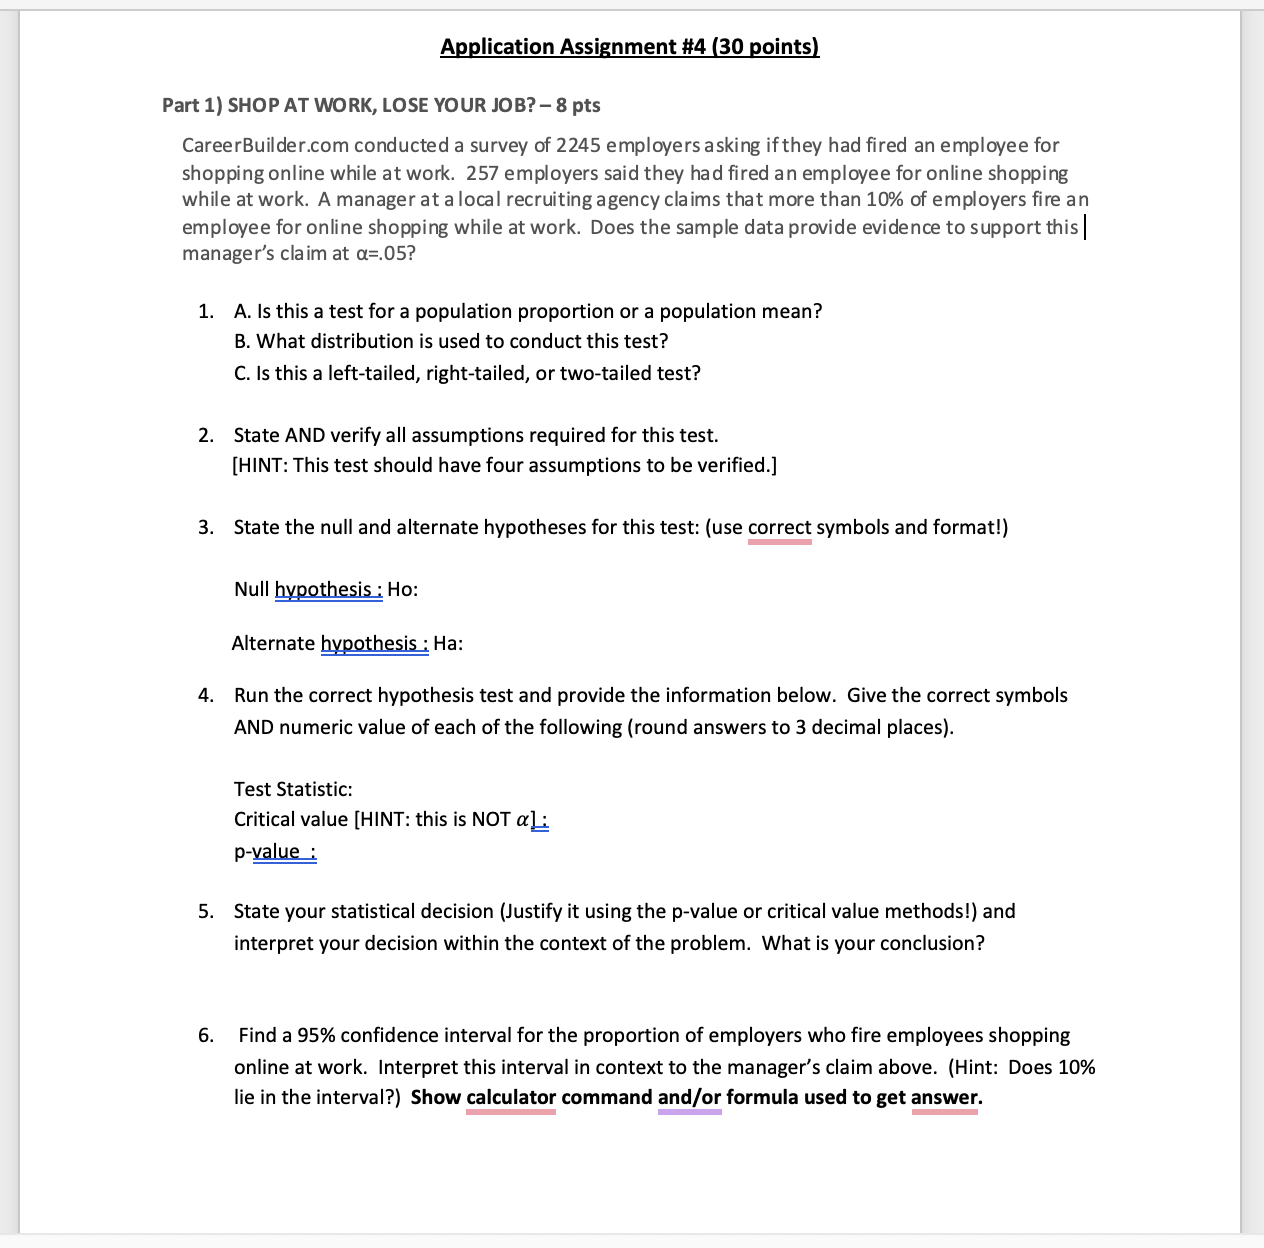
Math 215 Statistical Concepts 1. 5. A. Is this a test for a difference in two population proportions or two population means? If two population means, are the samples dependent or independent? B. What distribution is used to conduct this test? C. Is this a left-tailed, right-tailed, or two-tailed test? State AND verify all assumptions required for this test. [HINT: This test should have two assumptions to be verified.] State the null and alternate hypotheses for this test: (use correct symbols and format!) Null hypothesis : Ho: Alternate hypothesis : H; : Run the correct hypothesis test and provide the information below. Give the correct symbols AND numeric value of each of the following (round answers to 3 decimal places). Test Statistic: Critical value [HINT: this is NOT a]: Degrees of freedom: p-yalue State your statistical decision (Justify it using the p-value or critical value methods!) and interpret your decision within the context of the problem. What is your conclusion? Part 5) REFLECTION OF YOUR LEARNING - 3 pts Reviewing your own learning experience of the various hypothesis tests, summarize in a paragraph what a hypothesis test does in general terms. Then, describe a situation from your work where you could use what you learned about hypothesis testing to solve a problem. Part 3) DOES SOCIAL MEDIA AFFECT GRADES? - 5 pts The dean at a local university is concerned about what affects the GPAs of students. Astudy is done to see if students who use social media extensively have lower GPAs than students who do not use social media extensively. Two random samples of students were taken from the university and the sample statistics are below: Population Sample Size Sample Mean Sample Standard Deviation Students use social media n1= 135 x1= 3.01 $1 = 0.98 extensively Students do not use social n2= 72 x2= 3.89 $2= 0.38 media extensively In order to help the dean to see the effect of extensive use of social media on GPA, create a 95% confidence interval for the difference between the mean GPA of students who use and do not use social media extensively. Interpret this interval in context of the study above. (Hint: Does 0 lie in the interval? What does it mean?) Show calculator command and/or formula used to get answer in order to receive full credit. Use full sentences to interpret your results. Part 4) WORD CLOUDS OR TEXT READING, WHICH IS FASTER? -6 pts Researchers conducted a study to see if viewing a word cloud results in a faster conclusion (less time) in determining if the document is worth reading in its entirety versus reviewing a text summary of the document. Ten individuals were randomly sampled to participate in this study. Each individual performed both tasks with a day separation in between to ensure the participants were not affected by the previous task. The results in seconds are in the table below. Test the hypothesis that the word cloud is faster than the text summary in determining if a document is worth reading at a=.05. Assume the sample of differences is from an approximately normal population. | Document | Time to do Text Scan Time to view Word Cloud Difference (Text Scan-Word Cloud) 1 3.51 2.93 2 2.90 3.05 3.73 2.69 2.59 1.95 2.42 2.19 6 5.43 3.60 1.93 1.89 2.37 2.01 40 00 2.81 2.39 10 2.67 2.75Part 2) TIME WASTED AT WORK? 8 pts An employment survey at a local small business was conducted to see how much time is wasted at work by employees during an 8-hour workday. Below are the results of a random sample of 10 employees employed at this small business who were asked to truthfully and anonymously record how much time in minutes is wasted in an 8-hour workday. The owner of the small business claims less than 115 minutes is wasted in an 8-hour workday. Does this data provide evidence to support the claim that employees waste lessthan 115 minutesin an 8-hour workday at a=.05? 1. v 6. Demonstrate this sample came from an approximately normal population by producing a graph. (Histogram, boxplot, dot plot or stem plot) Copy and paste your graph here. A. Is this a test for a population proportion or a population mean? B. What distribution is used to conduct this test? C. Is this a left-tailed, right-tailed, or two-tailed test? State AND verify all assumptions required for this test. [HINT: This test should have two assumptions to be verified.] State the null and alternate hypotheses for this test: (use correct symbols and format!) Null hypothesis : Ho: Alternate hypothesis : H; : Run the correct hypothesis test and provide the information below. Give the correct symbols AND numeric value of each of the following (round answers to 3 decimal places). Test Statistic: Critical value [HINT: this is NOT a]. Degrees of freedom: p-value : State your statistical decision (Justify it using the p-value or critical value methods!) and interpret your decision within the context of the problem. What is your conclusion? Application Assignment #4 (30 points) Part 1) SHOP AT WORK, LOSE YOUR JOB? - 8 pts CareerBuilder.com conducted a survey of 2245 employers asking ifthey had fired an employee for shopping online while at work. 257 employers said they had fired an employee for online shopping while at work. A manager at alocal recruiting agency claims that more than 10% of employers fire an employee for online shopping while at work. Does the sample data provide evidence to support this| manager's claim at a=.05? 1. A.lsthis a test for a population proportion or a population mean? B. What distribution is used to conduct this test? C. Is this a left-tailed, right-tailed, or two-tailed test? 2. State AND verify all assumptions required for this test. [HINT: This test should have four assumptions to be verified.] 3. State the null and alternate hypotheses for this test: (use correct symbols and format!) Null hypothesis : Ho: Alternate hypothesis : Ha: 4. Run the correct hypothesis test and provide the information below. Give the correct symbols AND numeric value of each of the following (round answers to 3 decimal places). Test Statistic: Critical value [HINT: this is NOT a].. p-value : 5. State your statistical decision (Justify it using the p-value or critical value methods!) and interpret your decision within the context of the problem. What is your conclusion? 6. Find a 95% confidence interval for the proportion of employers who fire employees shopping online at work. Interpret this interval in context to the manager's claim above. (Hint: Does 10% lie in the interval?) Show calculator command and/or formula used to get
Step by Step Solution
There are 3 Steps involved in it

Get step-by-step solutions from verified subject matter experts