

Question: MATH 2265 (08) - STATISTICS WITH APPLICATIONS R programming I am facing a lot of problems with my coding as I fix the coding but
MATH 2265 (08) - STATISTICS WITH APPLICATIONS
R programming
I am facing a lot of problems with my coding as I fix the coding but I am still confused as I try to fix the coding base on the instruction but instead I get errors. i need help understanding what I need to fix. More information will be shown from my professor R comments.
Professor comments that I need to fix for the project:
professor told me the problem with the assignment: I made comments on Project 1. The major issue that I see is that you did not actually collect any data. Instead, you randomly generated data. Then, you keep generating different data for different questions. Your responses to all questions need to be based on the data from Question. 1.
You need to save your data from question 1 to use it again in the subsequent questions. For example, if your data is on a data frame, then you would use that data frame for all subsequent questions. Based on what you have, you saved your data as "s" population = seq(1:10) s = sample(population,30, replace=TRUE) You said s = .... . So, you called your data "s."
The mean and median in 4 and 6 do not match. You need to use the data "s" in problem 6, not "mydata." According to # 8 there are no outliers. Once you fix #6, you need to six the subsequent problems.
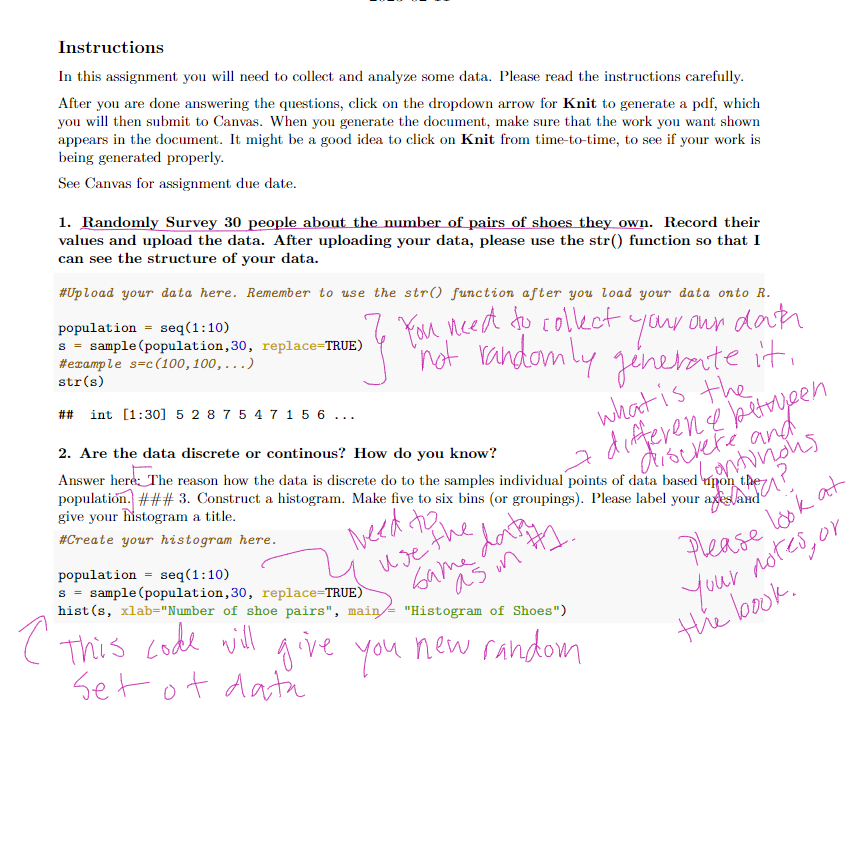
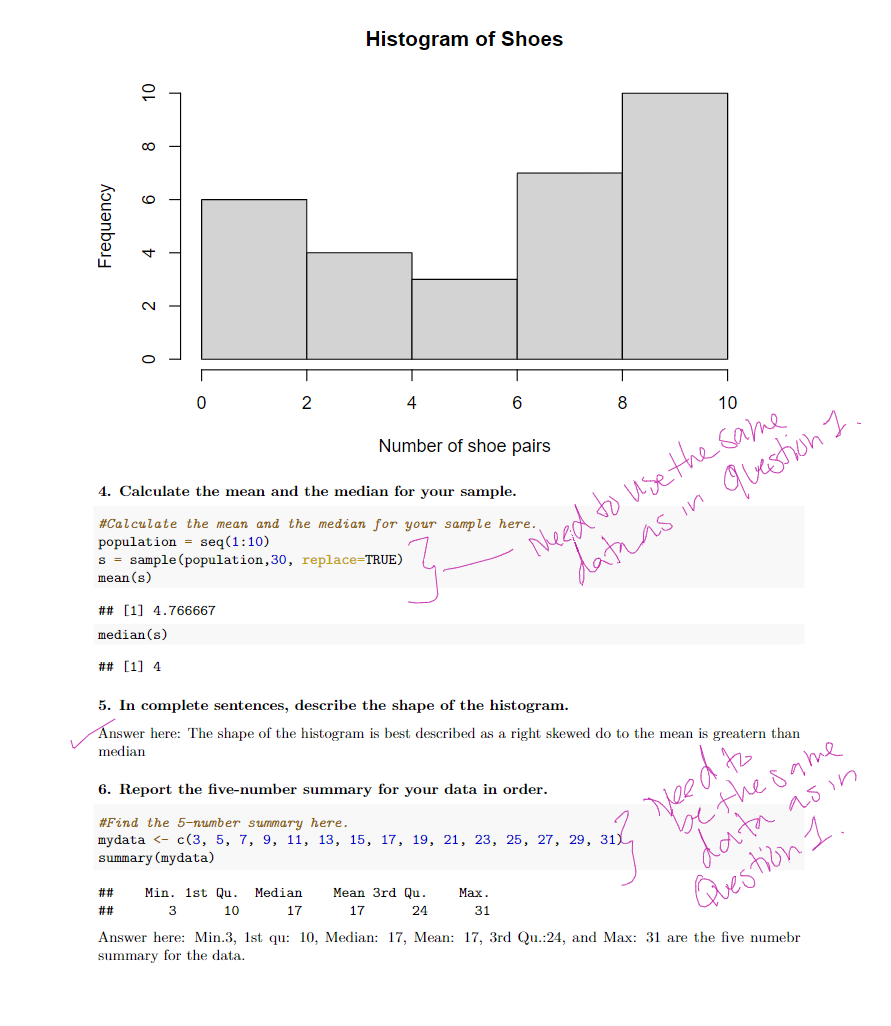
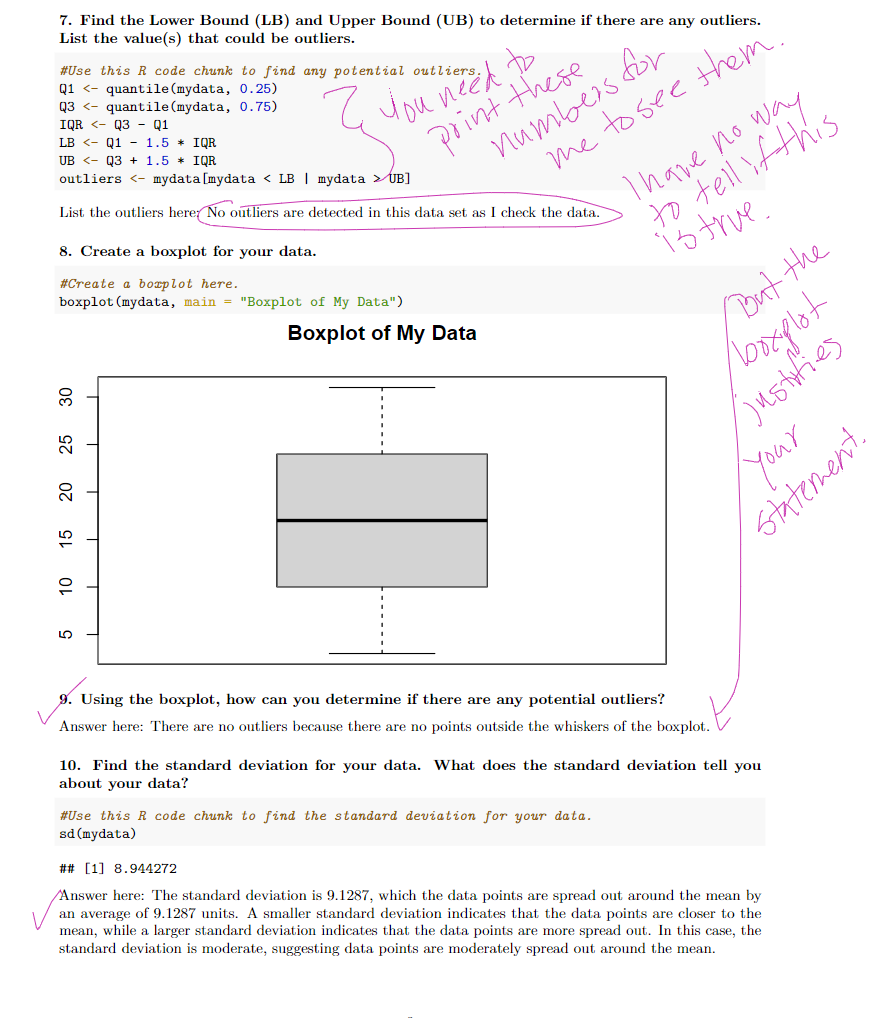
Instructions In this assignment you will need to collect and analyze some data. Please read the instructions carefully. After you are done answering the questions, click on the dropdown arrow for Knit to generate a pdf, which you will then submit to Canvas. When you generate the document, make sure that the work you want shown appears in the document. It might be a good idea to click on Knit from time-to-time, to see if your work is being generated properly. See Canvas for assignment due date. 1. Randomly Survey 30 people about the number of pairs of shoes they own. Record their values and upload the data. After uploading your data, please use the str() function so that I can see the structure of your data. \#Upload your data here. Remember to use the str() function after you load your data onto R. 2. Are the data discrete or continous? How do you know? population. \#\#\# 3. Construct a histogram. Make five to six bins (or groupings). Please label your afes d give your histogram a title. \#Create your histogram here. population =seq(1:10) s= sample (population, 30 , replace=TRUE) hist (s, xlab="Number of shoe pairs", main = "Histogram of Shoes") This coal vill ais atiotion Histoaram of Shoes 4. Calculate the mean and the median for your sample. \#Calculate the mean and the median for your sample here. population = seq (1:10) s=sample( population, 30, replace=TRUE) mean(s) \#\#[1] 4.766667 median(s) \#\#[1] 4 5. In complete sentences, describe the shape of the histogram. Answer here: The shape of the histogram is best described as a right skewed do to the mean is greatern than median 6. Report the five-number summary for your data in order. \#Find the 5-number summary here. Answer here: Min.3, 1st qu: 10, Median: 17, Mean: 17, 3rd Qu.:24, and Max: 31 are the five numebr summary for the data. 8. Create a boxplot for your data. \#Create a boxplot here. boxplot (mydata, main = "Boxplot of My Data") Boxplot of My Data 9. Using the boxplot, how can you determine if there are any potential outliers? Answer here: There are no outliers because there are no points outside the whiskers of the boxplot. 10. Find the standard deviation for your data. What does the standard deviation tell you about your data? \#Use this R code chunk to find the standard deviation for your data. sd (mydata) \#\#[1] 8.944272 Answer here: The standard deviation is 9.1287, which the data points are spread out around the mean by an average of 9.1287 units. A smaller standard deviation indicates that the data points are closer to the mean, while a larger standard deviation indicates that the data points are more spread out. In this case, the standard deviation is moderate, suggesting data points are moderately spread out around the mean
Step by Step Solution
There are 3 Steps involved in it

Get step-by-step solutions from verified subject matter experts