Question: Math 30-2: Units 5 - 8 Regression Assignment Name: Total Marks: {3|} Click here to review the Alberta Education Directing Words. These Directing Words are
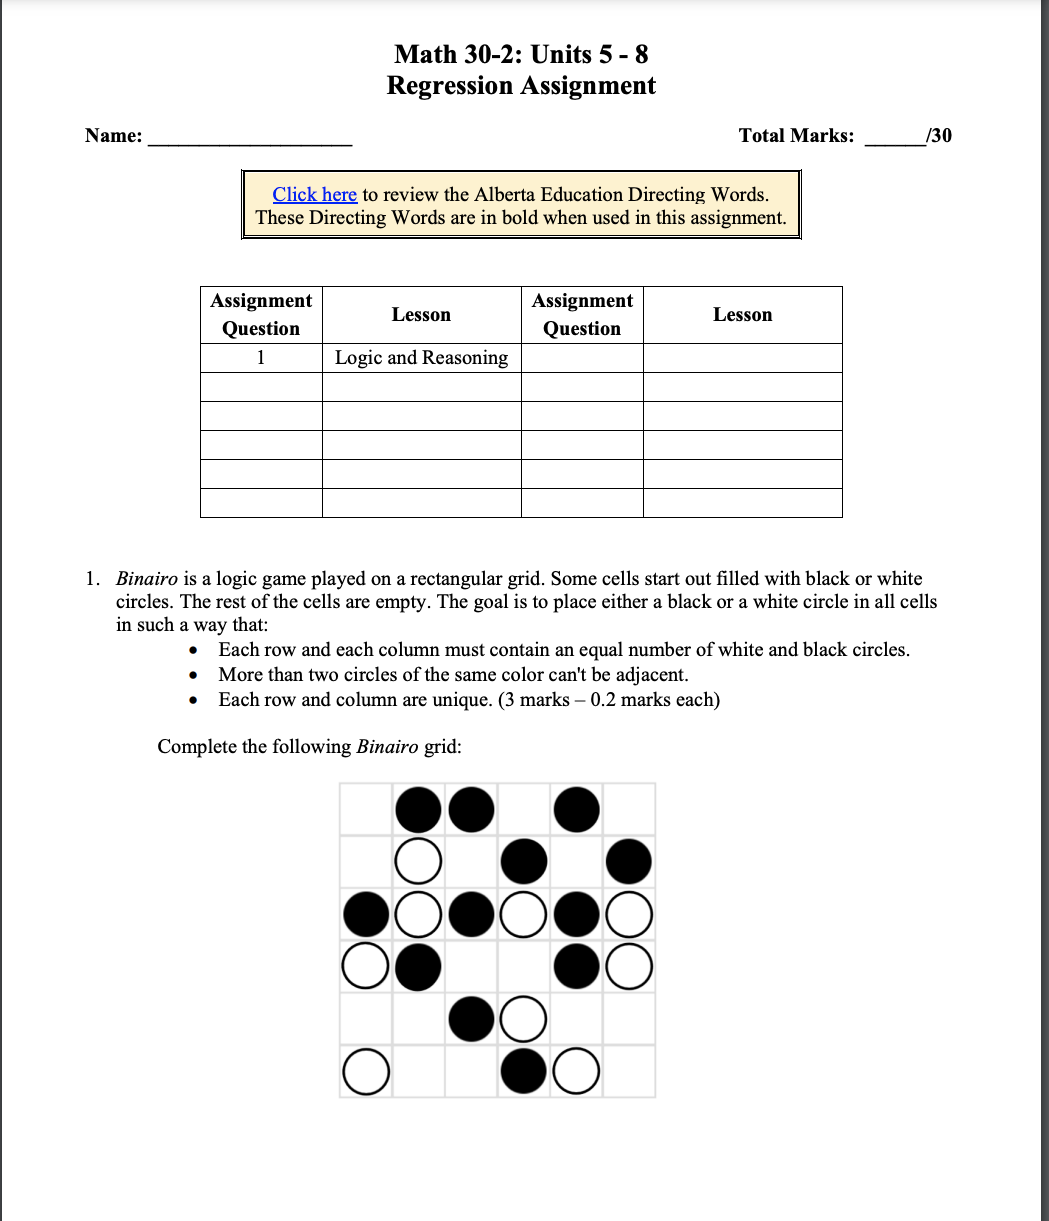
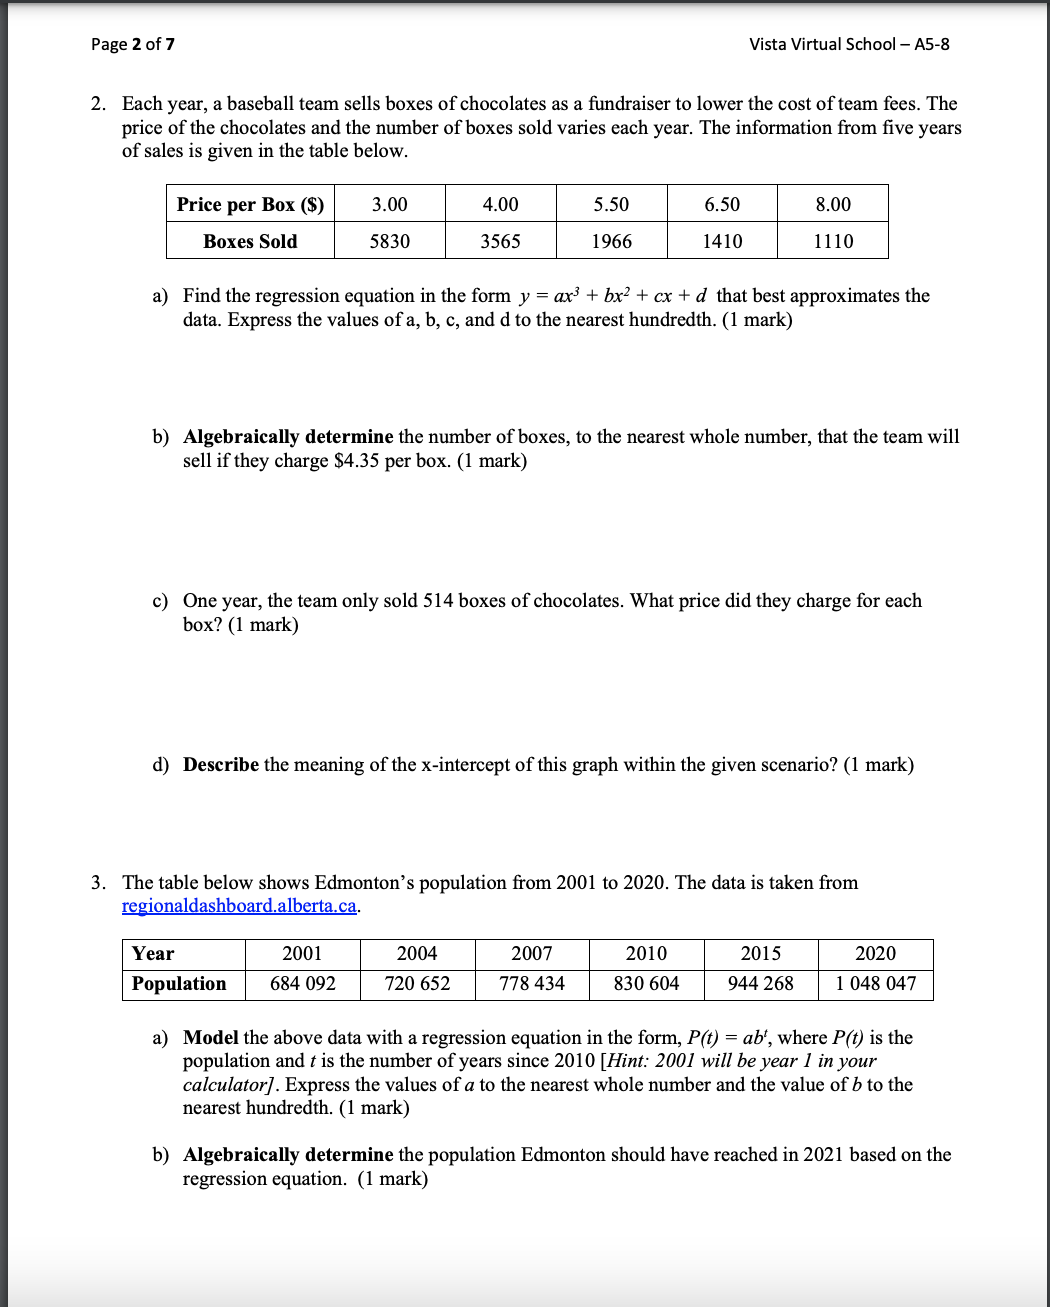
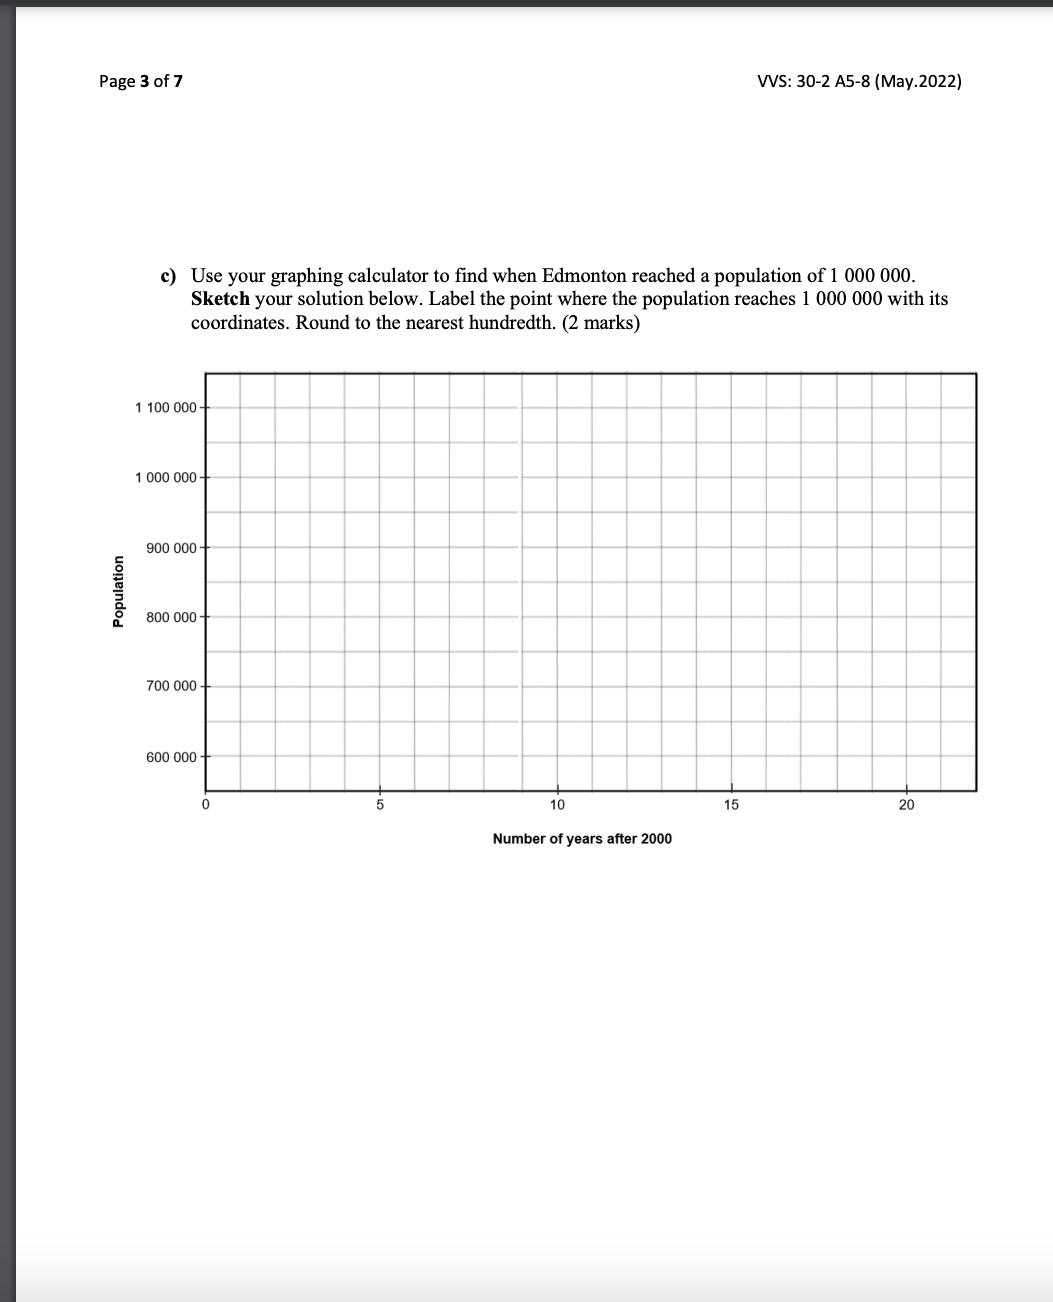
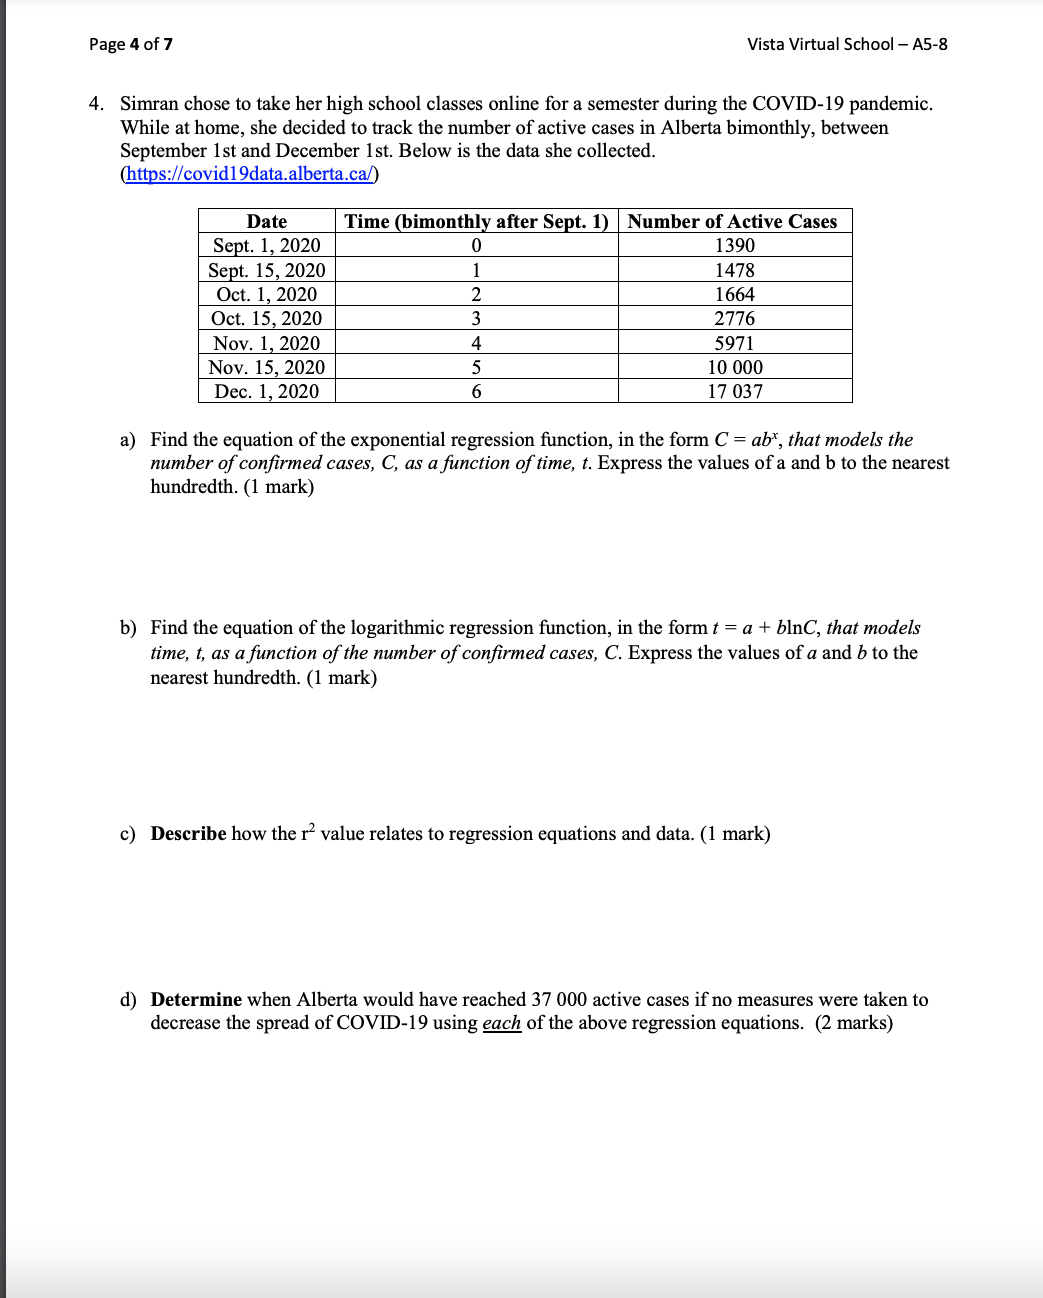
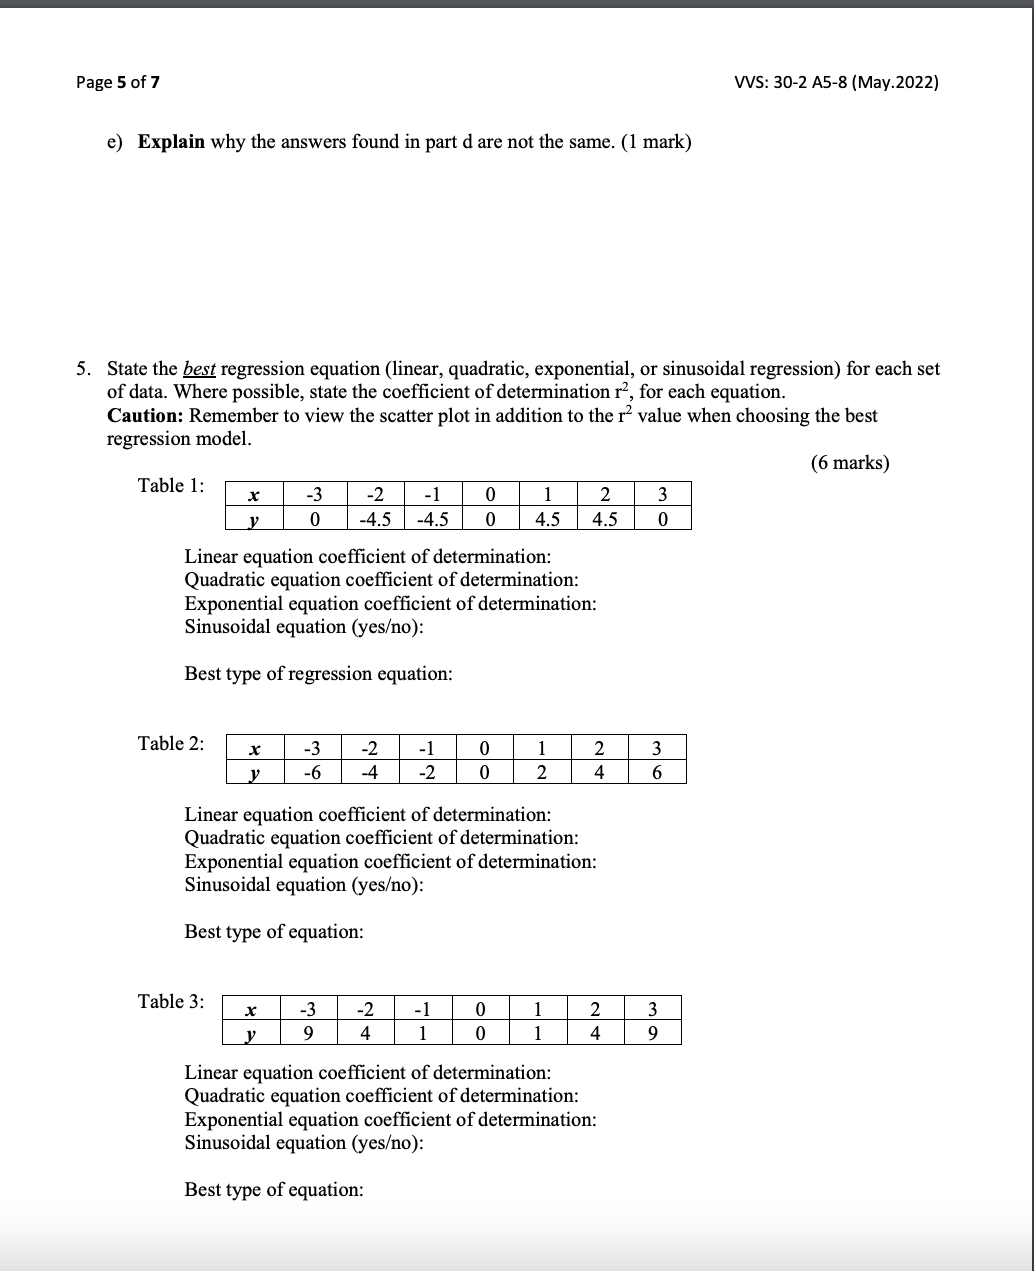
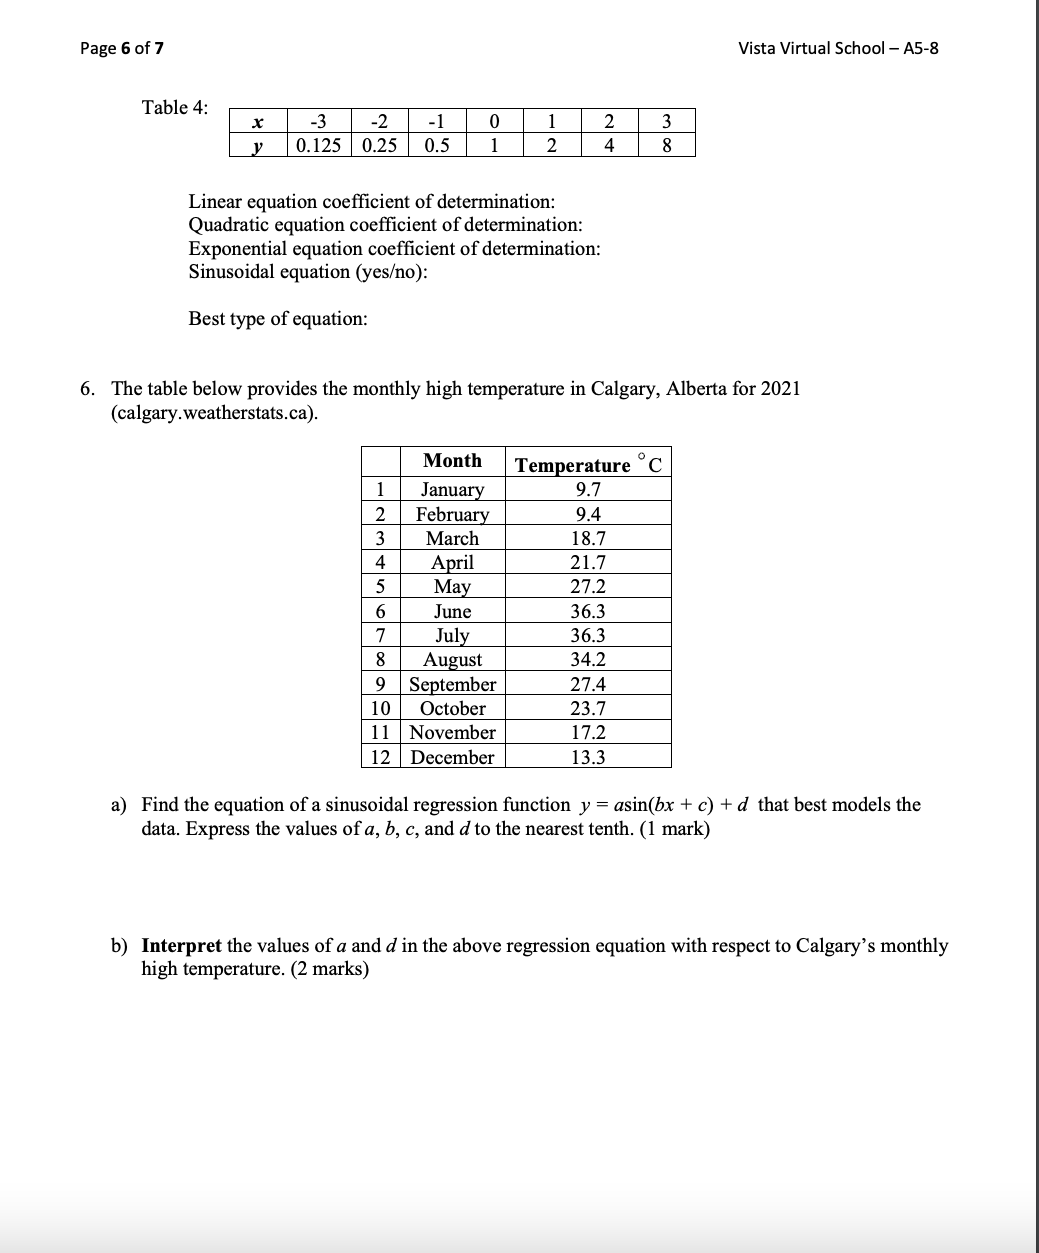
Math 30-2: Units 5 - 8 Regression Assignment Name: Total Marks: {3|} Click here to review the Alberta Education Directing Words. These Directing Words are in bold when used in this assignment. Assignment Assignment Lesson Lesson Question Question 1 Logic and Reasoning l. Binairo is a logic game played on a rectangular grid. Some cells start out lled with black or white circles. The rest of the cells are empty. The goal is to place either a black or a white circle in all cells in such a way that: I Each row and each column must contain an equal number of white and black circles. I More than two circles of the same color can't be adjacent. I Each row and column are unique. (3 marks 0.2 marks each) Complete the following Sinatra grid: .0 O O O 0 00.0.0 0. CO OO O CO Page 2 of 7 of sales is given in the table below. Vista Virtual School A5-8 2. Each year, a baseball team sells boxes of chocolates as a fundraiser to lower the cost of team fees. The price of the chocolates and the number of boxes sold varies each year. The information from ve years Price per Box (3) 3.00 4.00 5.50 6.50 8.00 Boxes Sold 5830 3565 1966 1410 1110 a) Find the regression equation in the form y = ax} + bx? + at + d that best approximates the data. Express the values of a, b, c, and d to the nearest hundredth. (1 mark) b) Algebraically determine the number of boxes, to the nearest whole number, that the team will sell ifthey charge $4.35 per box. (1 mark) c) One year, the team only sold 514 boxes of chocolates. What price did they charge for each box? (1 mark) (1) Describe the meaning of the x-intercept of this graph within the given scenario? (1 mark) 3. The table below shows Edmonton's population from 2001 to 2020. The data is taken from regionaldashboard.alberta.ca. Year 2001 2004 200'?r 2010 2015 2020 Population 684 092 720 652 778 434 83 0 604 944 268 1 048 04'?r a) Model the above data with a regression equation in the form, P(t) = ab', where Pm is the population and r is the number of years since 2010 [Hint 200] will be year I in your calculator]. Express the values of a to the nearest whole number and the value of b to the nearest hundredth. (1 mark) b) Algebraieally determine the population Edmonton should have reached in 2021 based on the regression equation. (1 mark) Page 3 of 7 W5: 30-2 A5-8 {May.2022) c} Use your graphing calculator to nd when Edmonton reached a population of 1 000 000. Sketch your solution below. Label the point where the population reaches 1 000 000 with its coordinates. Round to the nearest hundredth. (2 marks) 1 100 000 1 000 000 900 DUO Population 800 000 ND 000 600 000 0 5 10 15 20 Number of years after 2000 Page 4 of 7 Vista Virtual School - A5-8 4. Simran chose to take her high school classes online for a semester during the COVID-19 pandemic. While at home, she decided to track the number of active cases in Alberta bimonthly, between September 1st and December 1st. Below is the data she collected. (https://covid19data.alberta.ca/) Date Time (bimonthly after Sept. 1) |Number of Active Cases Sept. 1, 2020 0 1390 Sept. 15, 2020 Oct. 1, 2020 IN 1664 Oct. 15, 2020 3 2776 Nov. 1, 2020 5971 Nov. 15, 2020 10 000 Dec. 1, 2020 6 17 037 a) Find the equation of the exponential regression function, in the form C = abt, that models the number of confirmed cases, C, as a function of time, t. Express the values of a and b to the nearest hundredth. (1 mark) b) Find the equation of the logarithmic regression function, in the form t = a + binC, that models time, t, as a function of the number of confirmed cases, C. Express the values of a and b to the nearest hundredth. (1 mark) c) Describe how the r value relates to regression equations and data. (1 mark) d) Determine when Alberta would have reached 37 000 active cases if no measures were taken to decrease the spread of COVID-19 using each of the above regression equations. (2 marks)Page 5 of 7 VVS: 30-2 A5-8 (May.2022) e) Explain why the answers found in part d are not the same. (1 mark) 5. State the best regression equation (linear, quadratic, exponential, or sinusoidal regression) for each set of data. Where possible, state the coefficient of determination r , for each equation. Caution: Remember to view the scatter plot in addition to the r value when choosing the best regression model. (6 marks) Table 1: x -3 -2 -1 0 1 2 3 0 4.5 4.5 0 Linear equation coefficient of determination: Quadratic equation coefficient of determination: Exponential equation coefficient of determination: Sinusoidal equation (yeso): Best type of regression equation: Table 2: 21 2 2 6 Linear equation coefficient of determination: Quadratic equation coefficient of determination: Exponential equation coefficient of determination: Sinusoidal equation (yeso): Best type of equation: Table 3: x - 3 - 2 -1 0 2 4 9 Linear equation coefficient of determination: Quadratic equation coefficient of determination: Exponential equation coefficient of determination: Sinusoidal equation (yeso): Best type of equation:Page 6 of 7 Vista Virtual School - A5-8 Table 4: X -3 -2 -1 0 1 2 3 V 0.125 0.25 0.5 1 2 4 8 Linear equation coefficient of determination: Quadratic equation coefficient of determination: Exponential equation coefficient of determination: Sinusoidal equation (yeso): Best type of equation: 6. The table below provides the monthly high temperature in Calgary, Alberta for 2021 (calgary. weatherstats.ca). Month Temperature C 1 January 9.7 2 February 9.4 3 March 18.7 4 April 21.7 5 May 27.2 6 June 36.3 7 July 36.3 8 August 34.2 9 September 27.4 10 October 23.7 11 November 17.2 12 December 13.3 a) Find the equation of a sinusoidal regression function y = asin(bx + c) + d that best models the data. Express the values of a, b, c, and d to the nearest tenth. (1 mark) b) Interpret the values of a and d in the above regression equation with respect to Calgary's monthly high temperature. (2 marks)Page 7 of 7 W5: 30-2 A5-8 [May.2022) c) Algebraically determine, using your equation from part a, the predicted daily high temperature in Calgary in December 2022 to the nearest tenth. (1 mark) d) Sketch the graph of this regression equation below for 2021 and 2022. Be sure to label each axis and the scale used on each axis. (2 marks) e) Indicate on your sketch the point where the monthly high temperature will reach 25C for the second time in 2022. Include the coordinates of this point rounded to the nearest whole number. What month is represented by this point? (1 mark) End of Assignment
Step by Step Solution
There are 3 Steps involved in it
1 Expert Approved Answer
Step: 1 Unlock
Question Has Been Solved by an Expert!
Get step-by-step solutions from verified subject matter experts
Step: 2 Unlock
Step: 3 Unlock
Students Have Also Explored These Related Mathematics Questions!