

Question: Math 7 B (CL); 7.20 / 5. Displaying and Analyzing Data / 5.10. Displaying and Analyzing Data Unit Test X Note: Enter your answer and
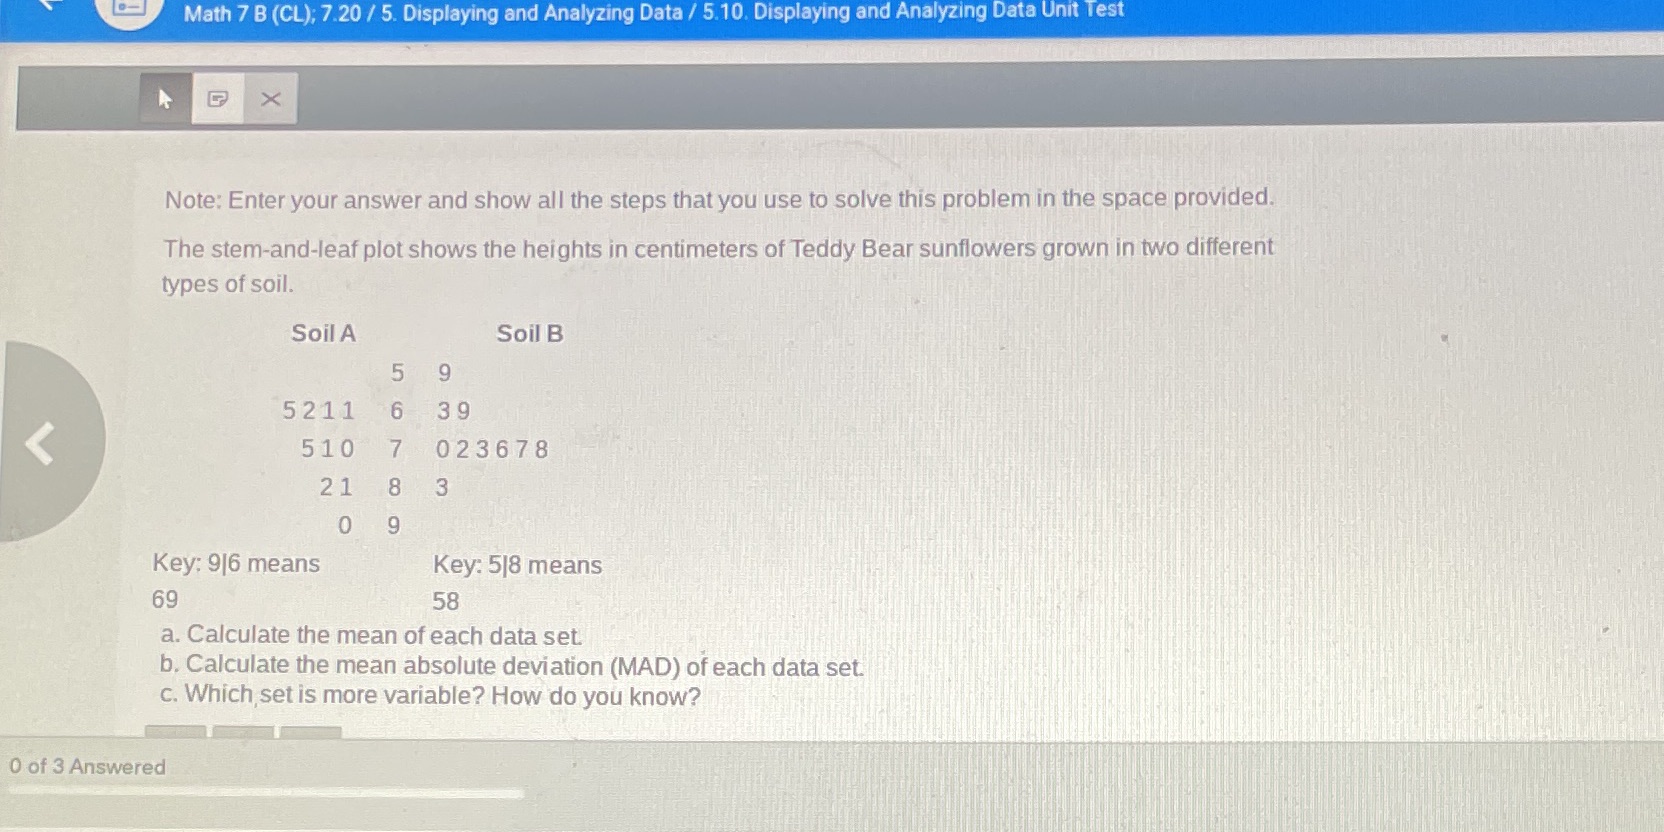
Math 7 B (CL); 7.20 / 5. Displaying and Analyzing Data / 5.10. Displaying and Analyzing Data Unit Test X Note: Enter your answer and show all the steps that you use to solve this problem in the space provided. The stem-and-leaf plot shows the heights in centimeters of Teddy Bear sunflowers grown in two different types of soil. Soil A Soil B 5 9 5211 6 39 510 7 023678 21 8 3 0 9 Key: 916 means Key: 518 means 69 58 a. Calculate the mean of each data set. b. Calculate the mean absolute deviation (MAD) of each data set. c. Which set is more variable? How do you know? 0 of 3 Answered
Step by Step Solution
There are 3 Steps involved in it
1 Expert Approved Answer
Step: 1 Unlock

Question Has Been Solved by an Expert!
Get step-by-step solutions from verified subject matter experts
Step: 2 Unlock
Step: 3 Unlock