

Question: Math Activity 7-F-3 #1,#2 (page 1) using a graphing or spreadsheet tool, develop a table of function values to identify the end Uhavior of each
Math

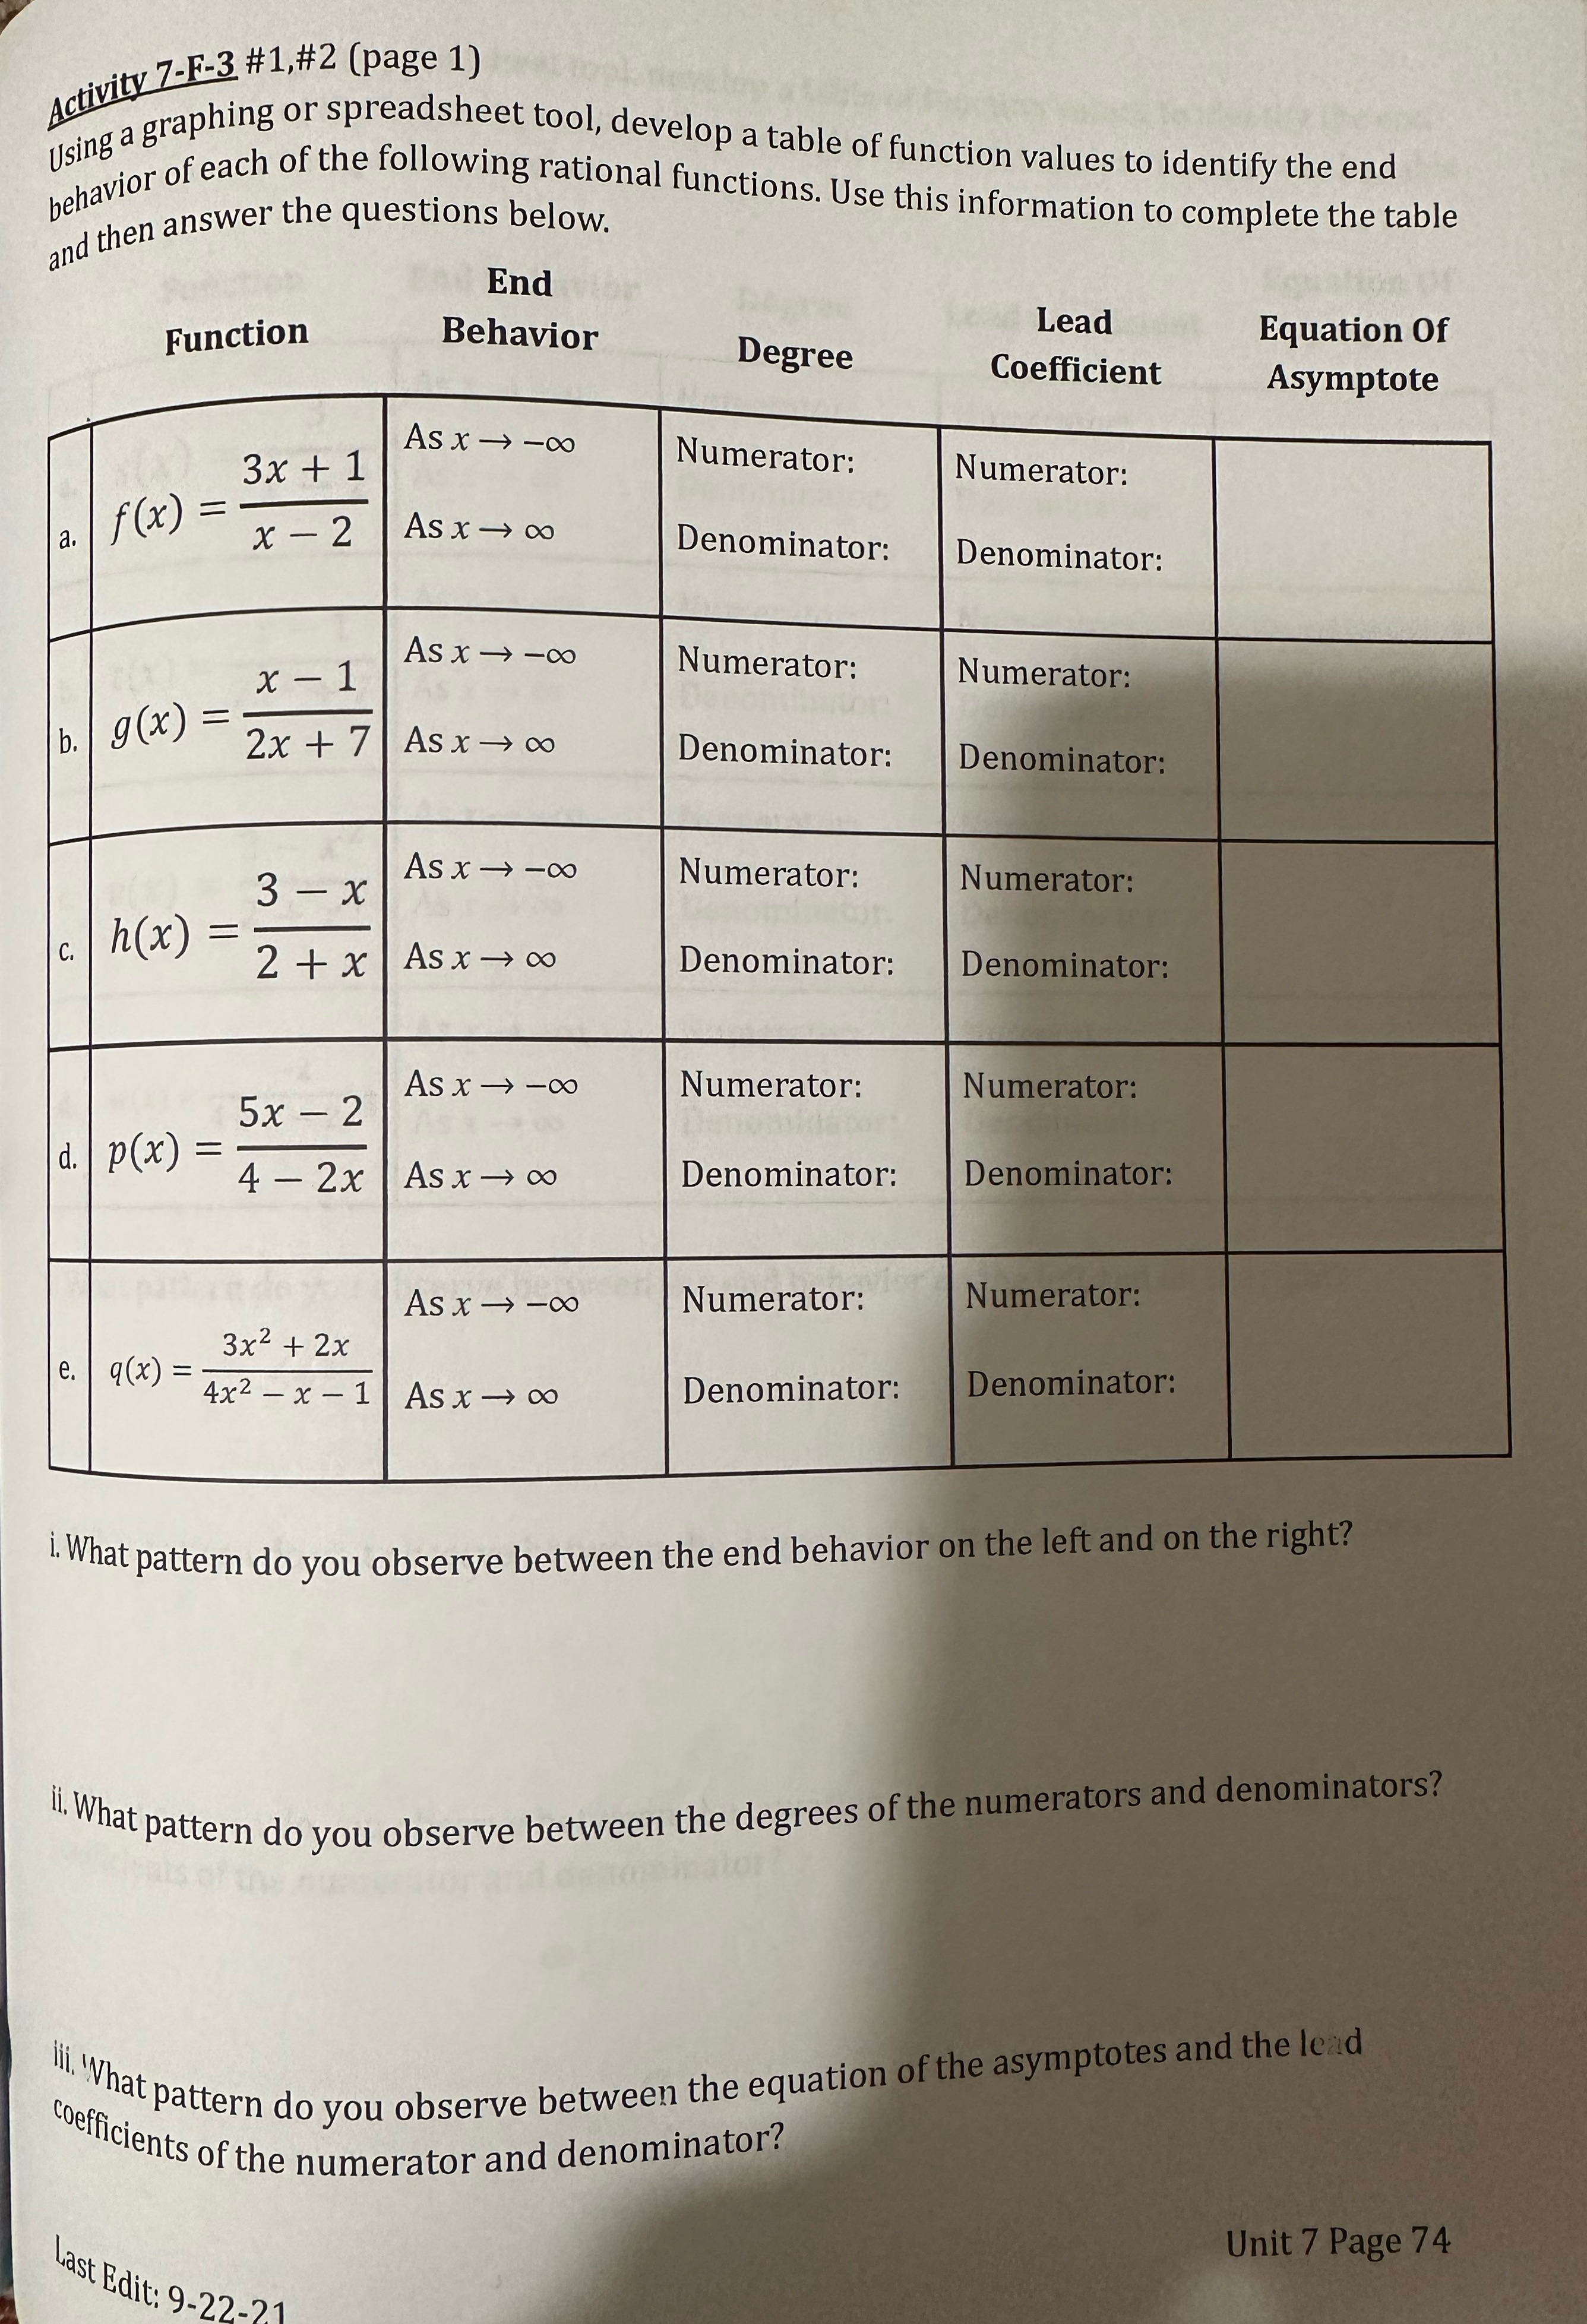
Activity 7-F-3 #1,#2 (page 1) using a graphing or spreadsheet tool, develop a table of function values to identify the end Uhavior of each of the following rational functions. Use this information to complete the table and then answer the questions below. End Lead Function Behavior Equation Of Degree Coefficient Asymptote As x - -00 3x + 1 Numerator: Numerator: a. If ( x ) : x - 2 As x -+ 00 Denominator: Denominator: As x - -0o x - 1 Numerator: Numerator: b. g (x) = 2x + 7 As x -+ 0 Denominator: Denominator: As x - -00 3- X Numerator: Numerator: c. h ( x) = 2+x Asx - co Denominator: Denominator: As x - -co Numerator: Numerator: 5x - 2 d. p(x) = 4-2x As x -+ 00 Denominator: Denominator: As x - -co Numerator: Numerator: 3x2 + 2x e. 4x2 - x-1 As x - co Denominator: Denominator: i. What pattern do you observe between the end behavior on the left and on the right? . What pattern do you observe between the degrees of the numerators and denominators? What pattern do you observe between the equation of the asymptotes and the lead Coefficients of the numerator and denominator? Unit 7 Page 74 Last Edit: 9-22-21
Step by Step Solution
There are 3 Steps involved in it

Get step-by-step solutions from verified subject matter experts