

Question: Math | Graded Assignment | Unit Test, Part 2 | Bivariate Data (Score for Question 2: _ _of 5 points) 2. The table shows the
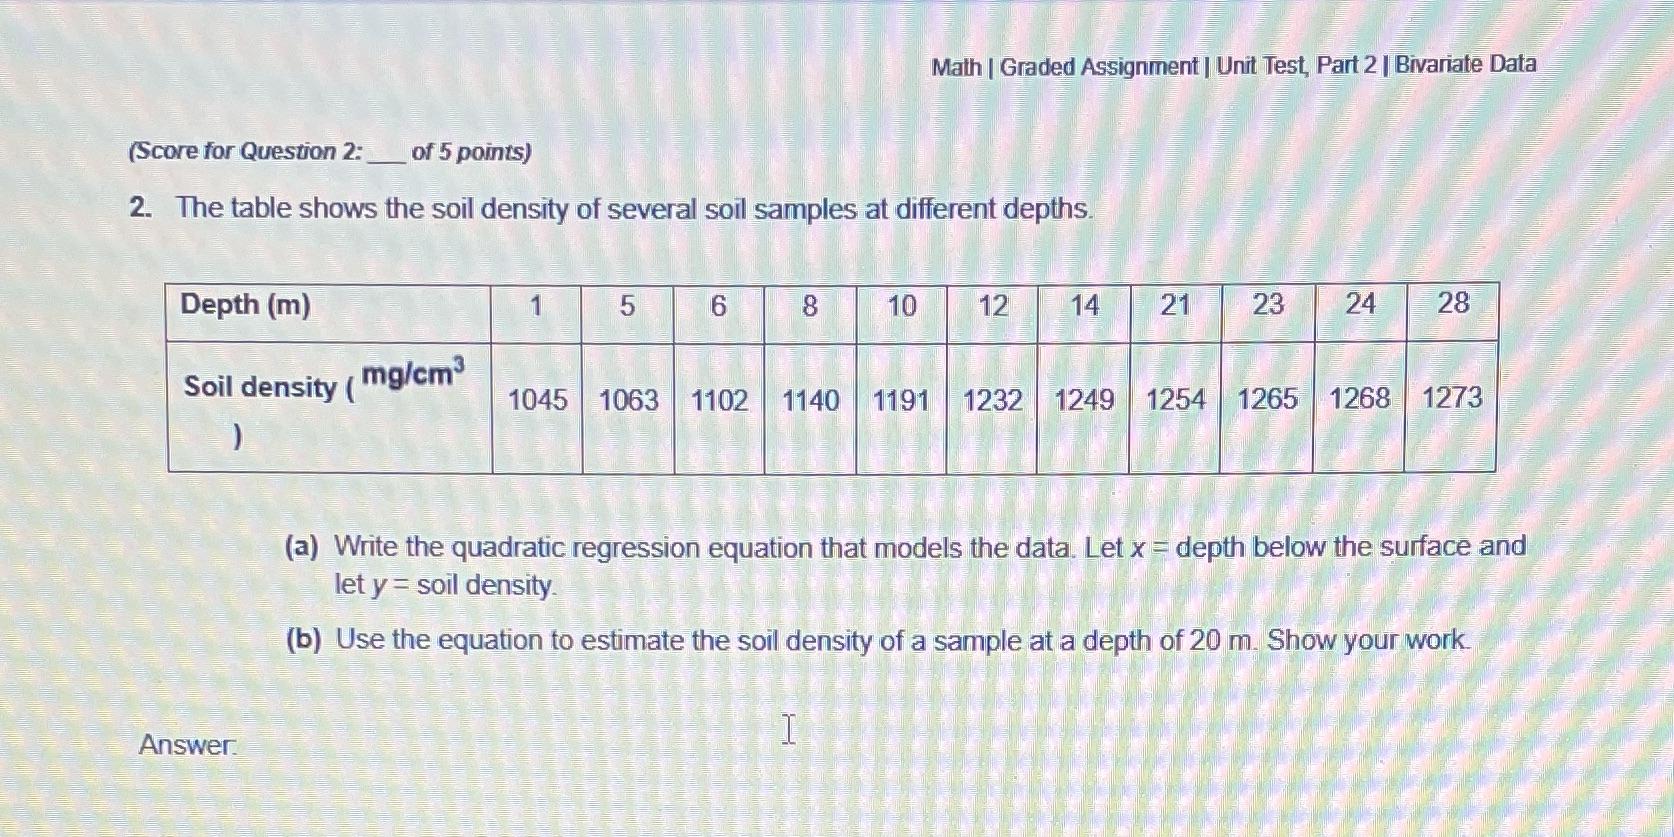
Math | Graded Assignment | Unit Test, Part 2 | Bivariate Data (Score for Question 2: _ _of 5 points) 2. The table shows the soil density of several soil samples at different depths. Depth (m) 5 6 8 10 12 14 21 23 24 28 Soil density ( mg/cm3 1045 1063 1102 1140 1191 1232 1249 1254 1265 1268 1273 (a) Write the quadratic regression equation that models the data. Let x = depth below the surface and let y = soil density. (b) Use the equation to estimate the soil density of a sample at a depth of 20 m. Show your work.
Step by Step Solution
There are 3 Steps involved in it
1 Expert Approved Answer
Step: 1 Unlock

Question Has Been Solved by an Expert!
Get step-by-step solutions from verified subject matter experts
Step: 2 Unlock
Step: 3 Unlock