

Question: MAth In Context 3.3: Construct a time series plot in Excel that compares Durant's and Curry's performance over the first 20 games. Paste it here.
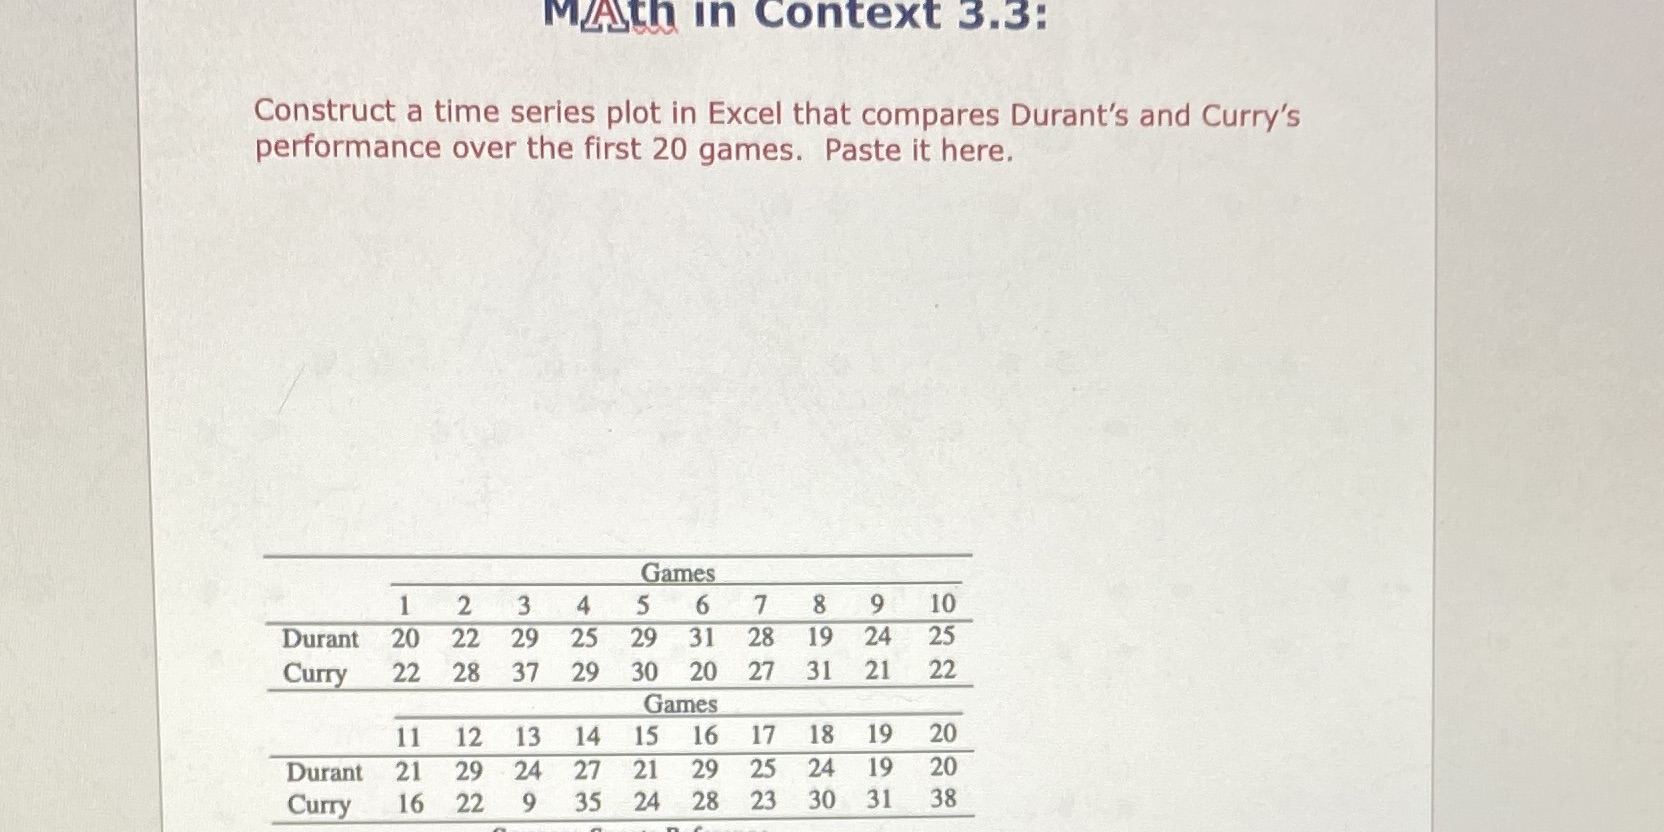
MAth In Context 3.3: Construct a time series plot in Excel that compares Durant's and Curry's performance over the first 20 games. Paste it here. Games 1 2 3 4 5 6 7 8 9 10 Durant 20 22 29 25 29 31 28 19 24 25 Curry 22 28 37 29 30 20 27 31 21 22 Games 11 12 13 14 15 16 17 18 19 20 Durant 21 29 24 27 21 29 25 24 19 20 Curry 16 22 9 35 24 28 23 30 31 38
Step by Step Solution
There are 3 Steps involved in it
1 Expert Approved Answer
Step: 1 Unlock

Question Has Been Solved by an Expert!
Get step-by-step solutions from verified subject matter experts
Step: 2 Unlock
Step: 3 Unlock