

Question: Math Linear Inequalities In the previous activity, you made trade-offs based on real-world constraints. We can represent these types of constraints using linear inequalities. Explore
Math
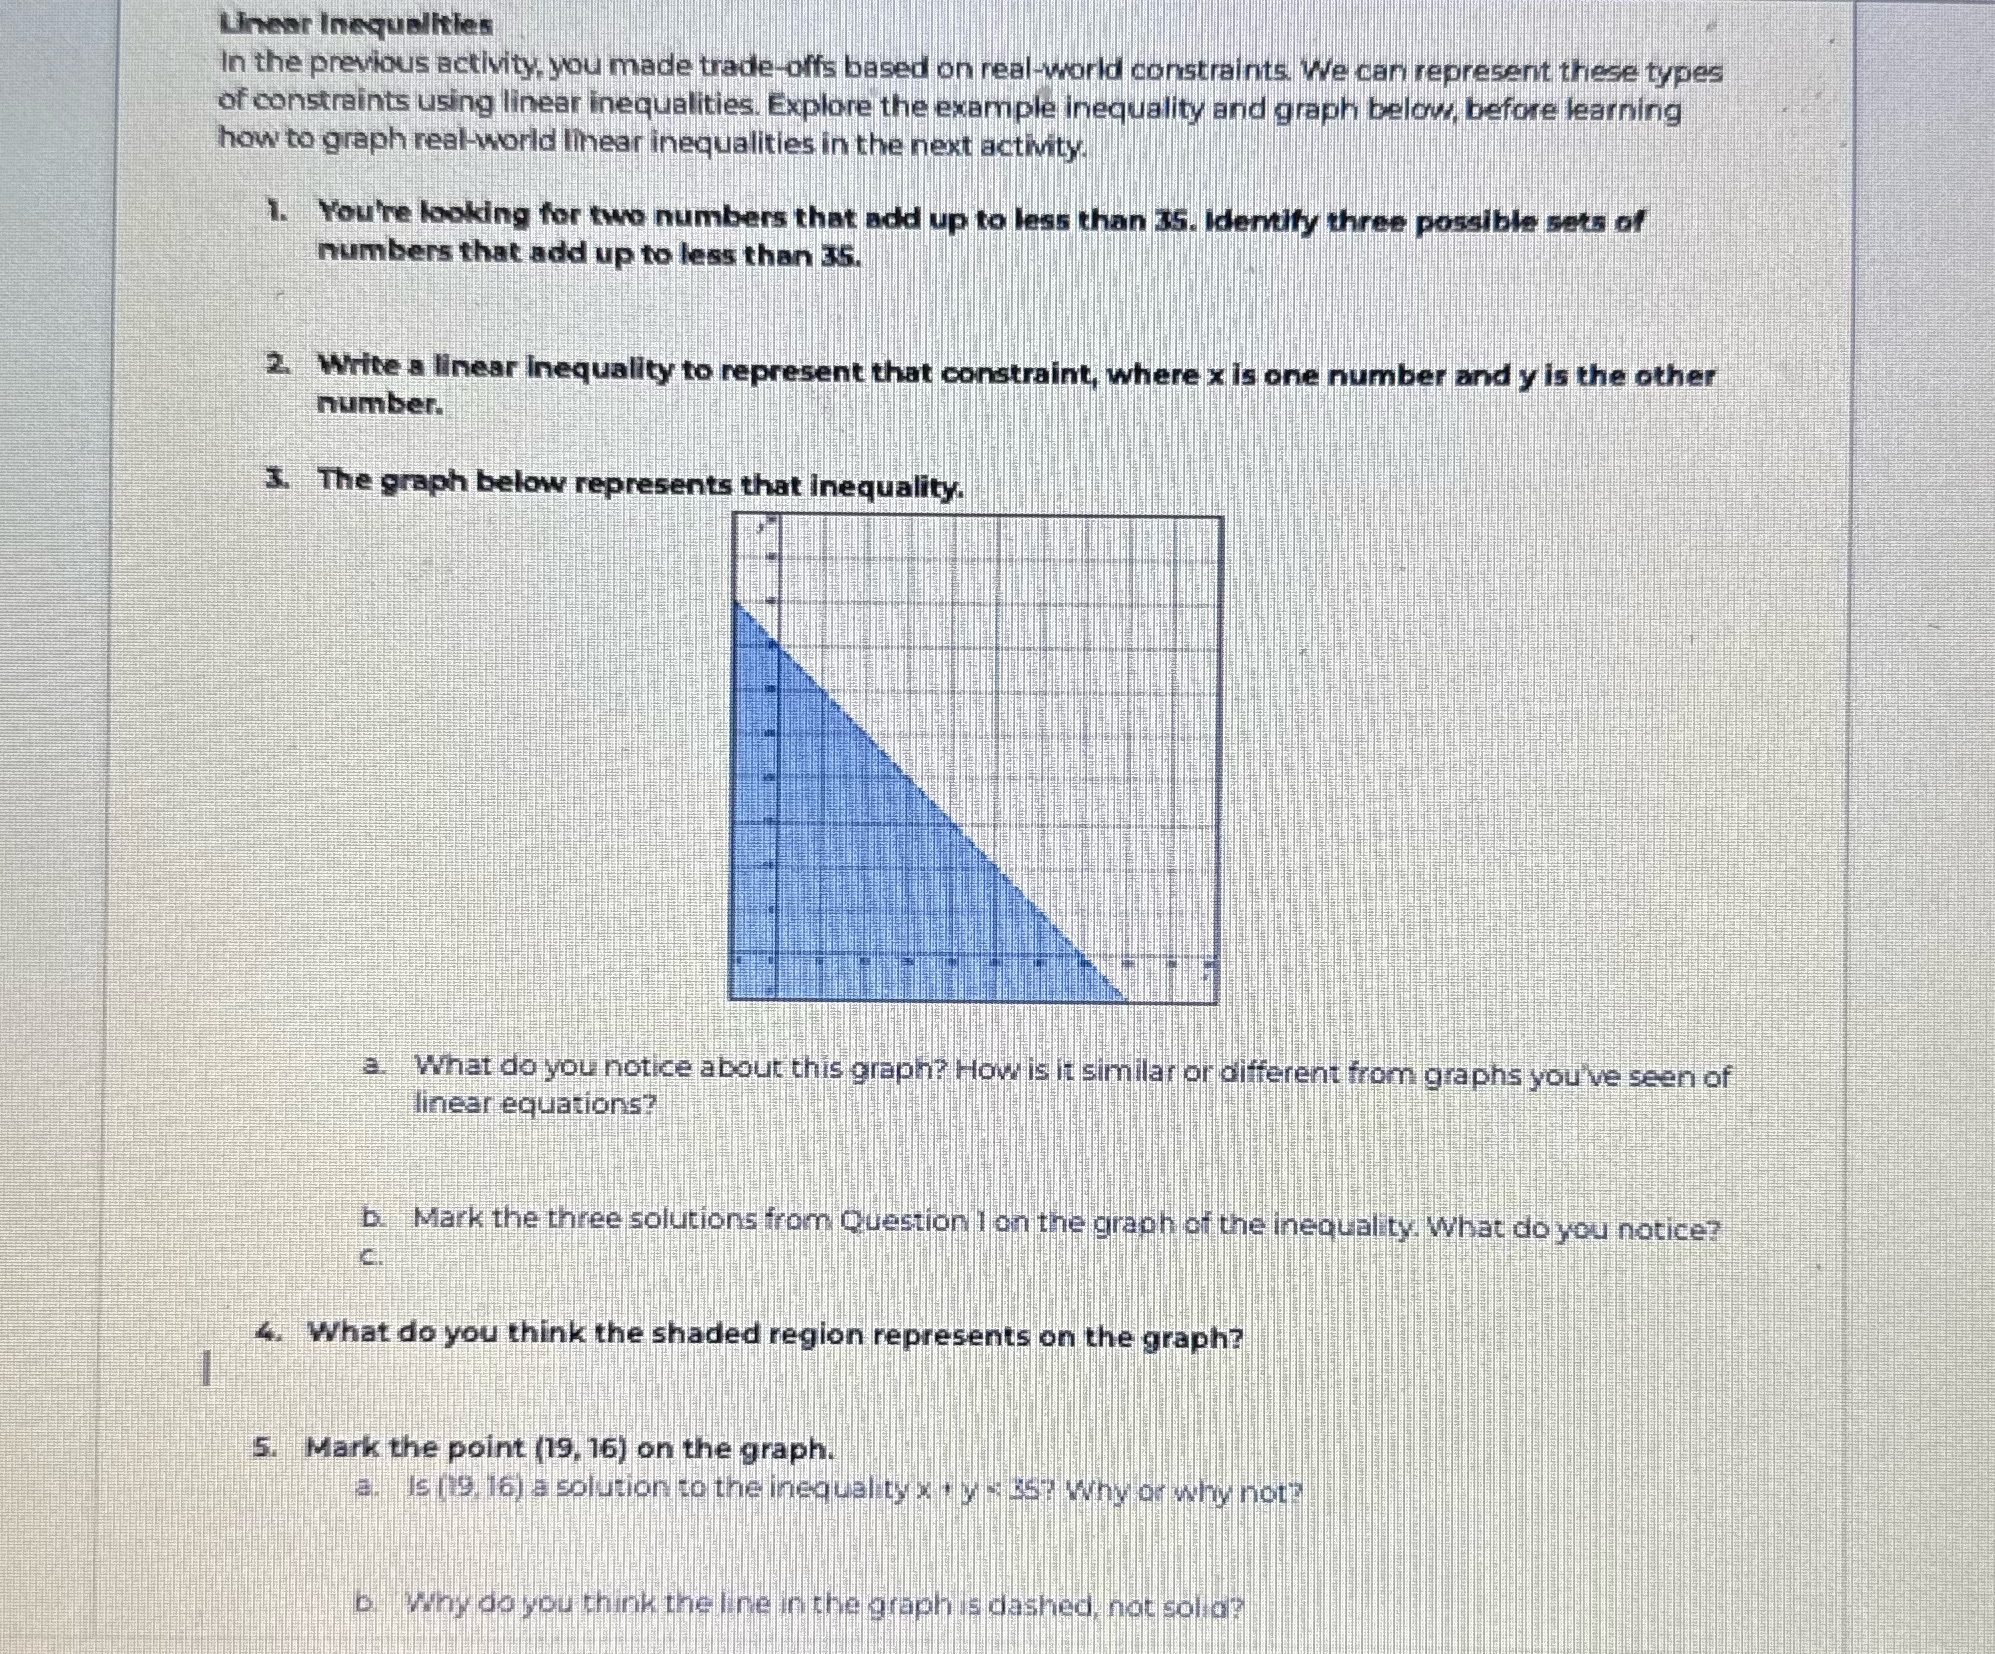
Linear Inequalities In the previous activity, you made trade-offs based on real-world constraints. We can represent these types of constraints using linear inequalities. Explore the example inequality and graph below, before learning how to graph real-world linear inequalities in the next activity. 1. You're looking for two numbers that add up to less than 35. identify three possible sets of numbers that add up to less than 35. 2. Write a linear Inequality to represent that constraint, where x is one number and y is the other number. 3. The graph below represents that Inequality. a. What do you notice about this graph? How is it similar or different from graphs you've seen of linear equations b. Mark the three solutions from Question ] on the graph of the inequality. What do you notice? 4. What do you think the shaded region represents on the graph? 5. Mark the point (19, 16) on the graph. a. Is (9, 16) a solution to the inequality x * v - as: Why of why not b Why do you think the line in the graph is dashed, not sobio
Step by Step Solution
There are 3 Steps involved in it

Get step-by-step solutions from verified subject matter experts