

Question: Math statistics Module 4 Project ~ The Normal Probability Distribution Name Project due Date Use the tables on the following pages to answer all of
Math statistics
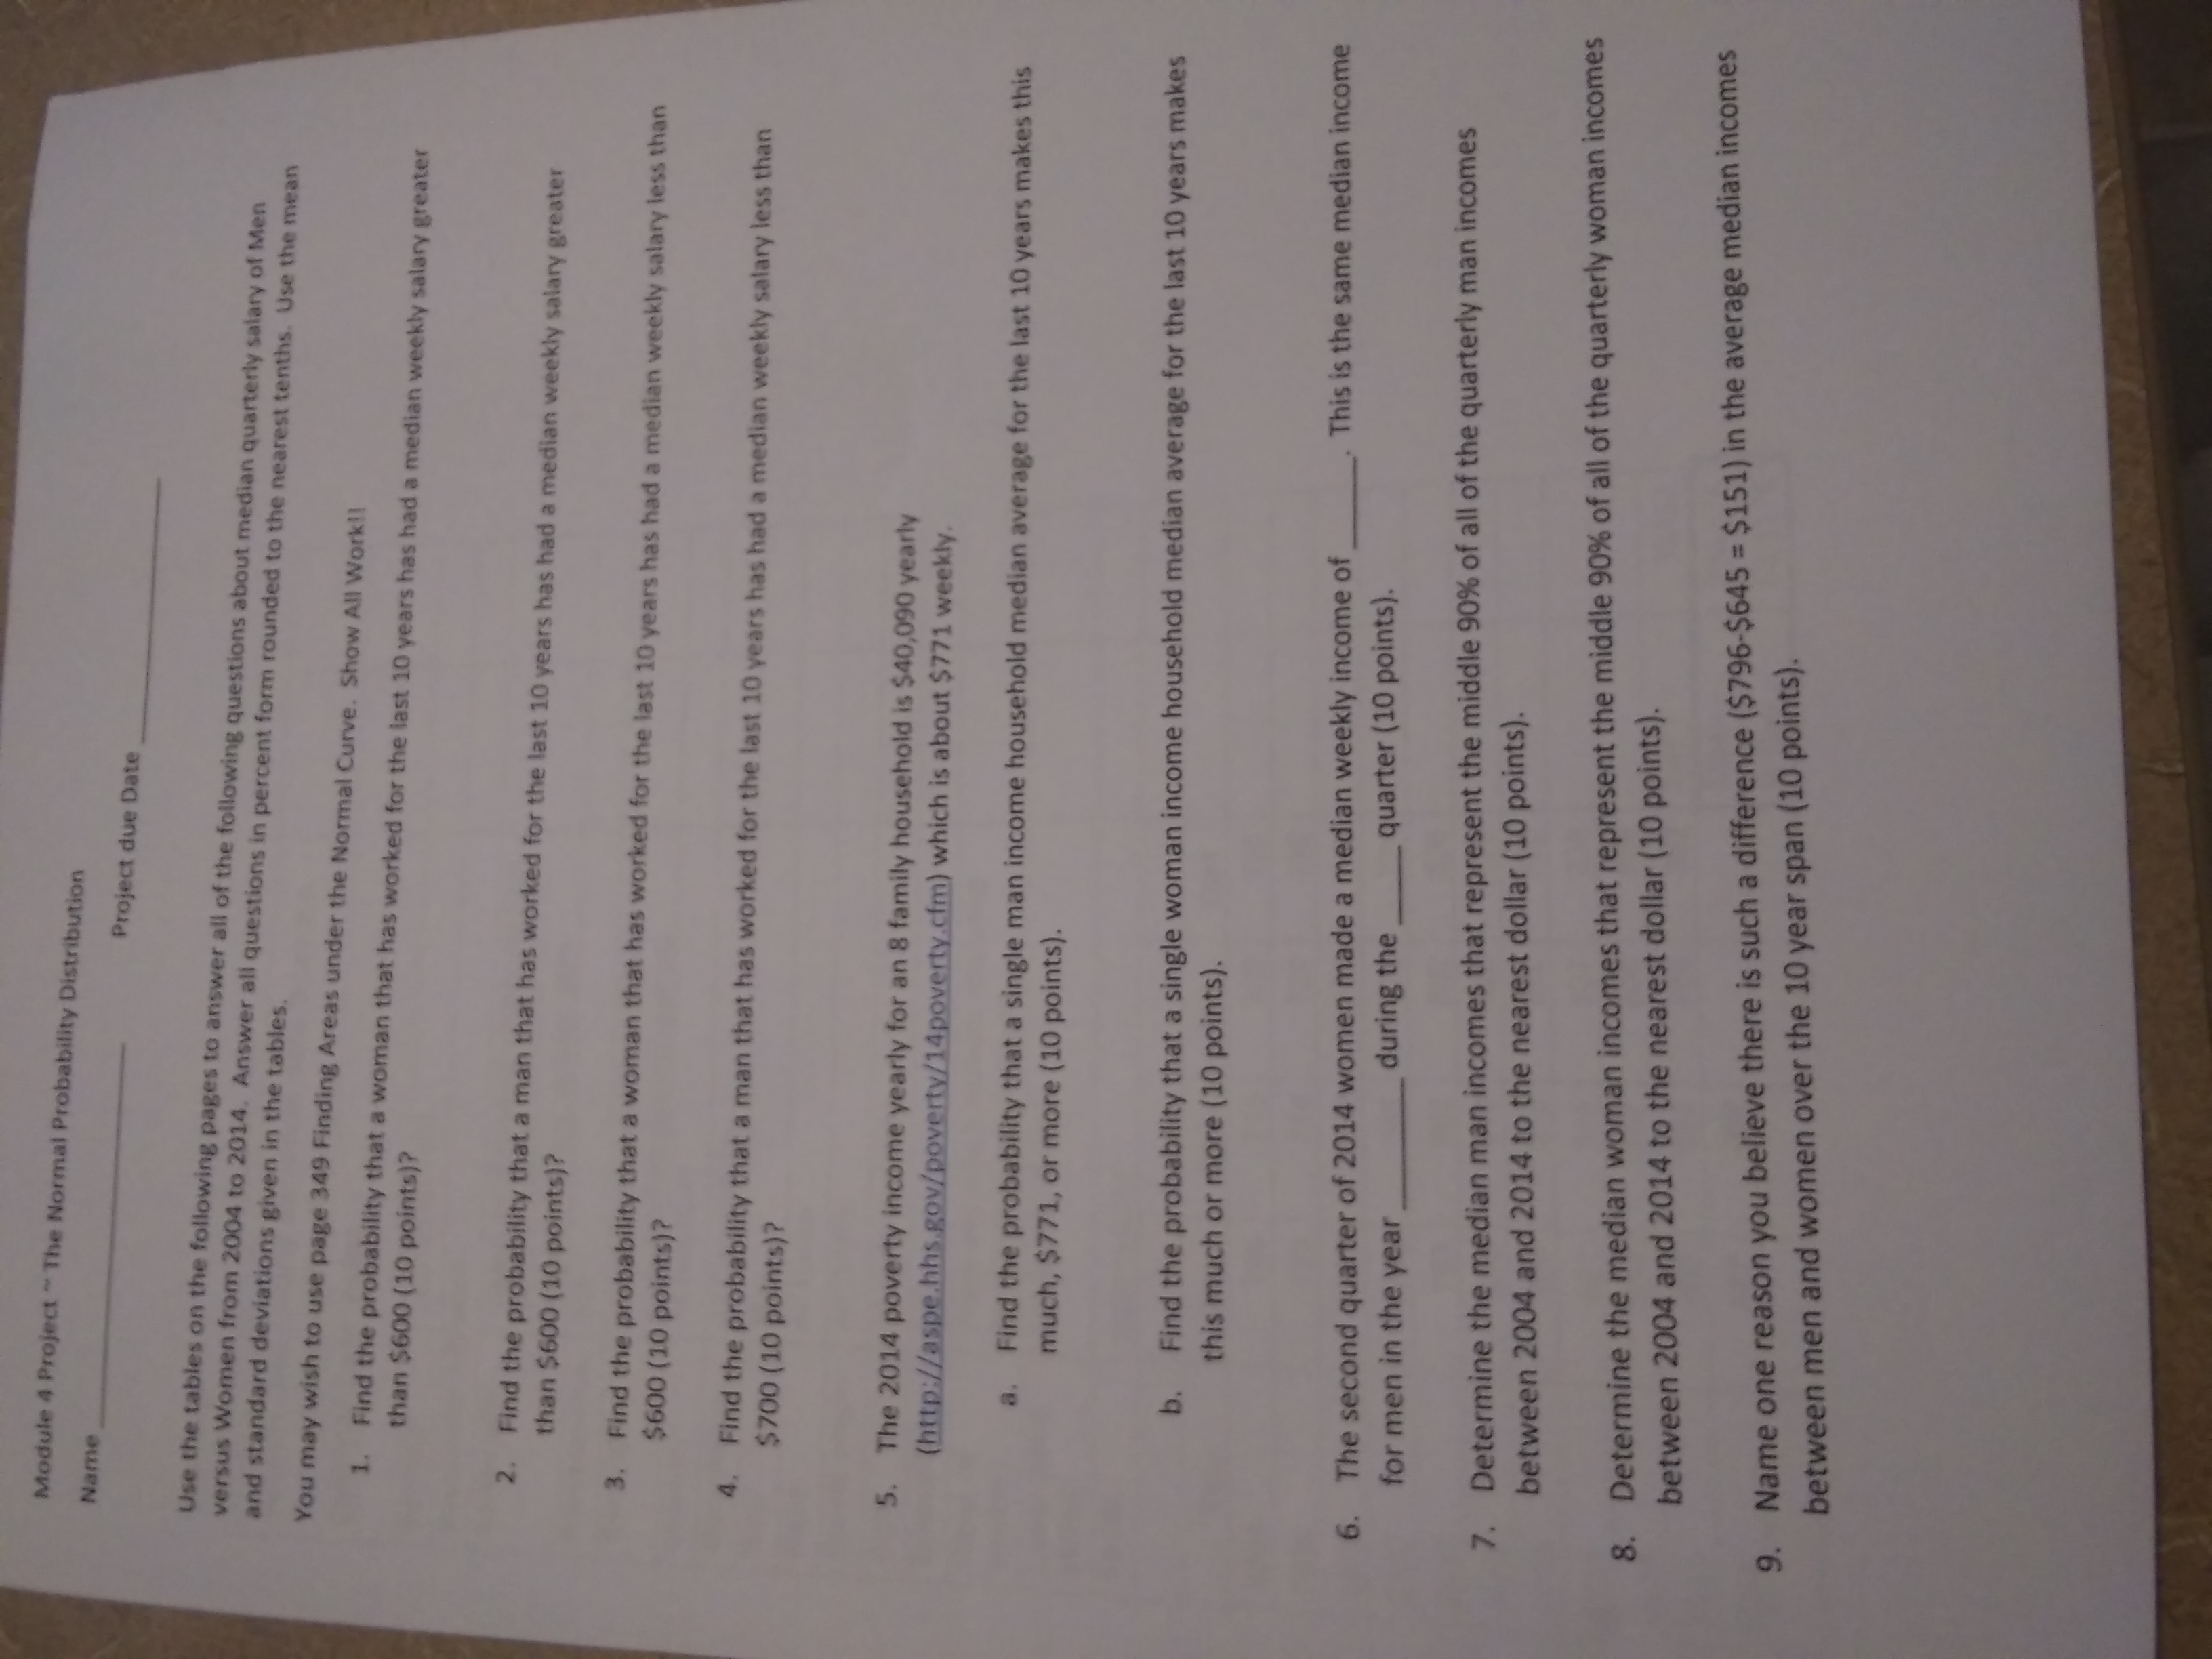
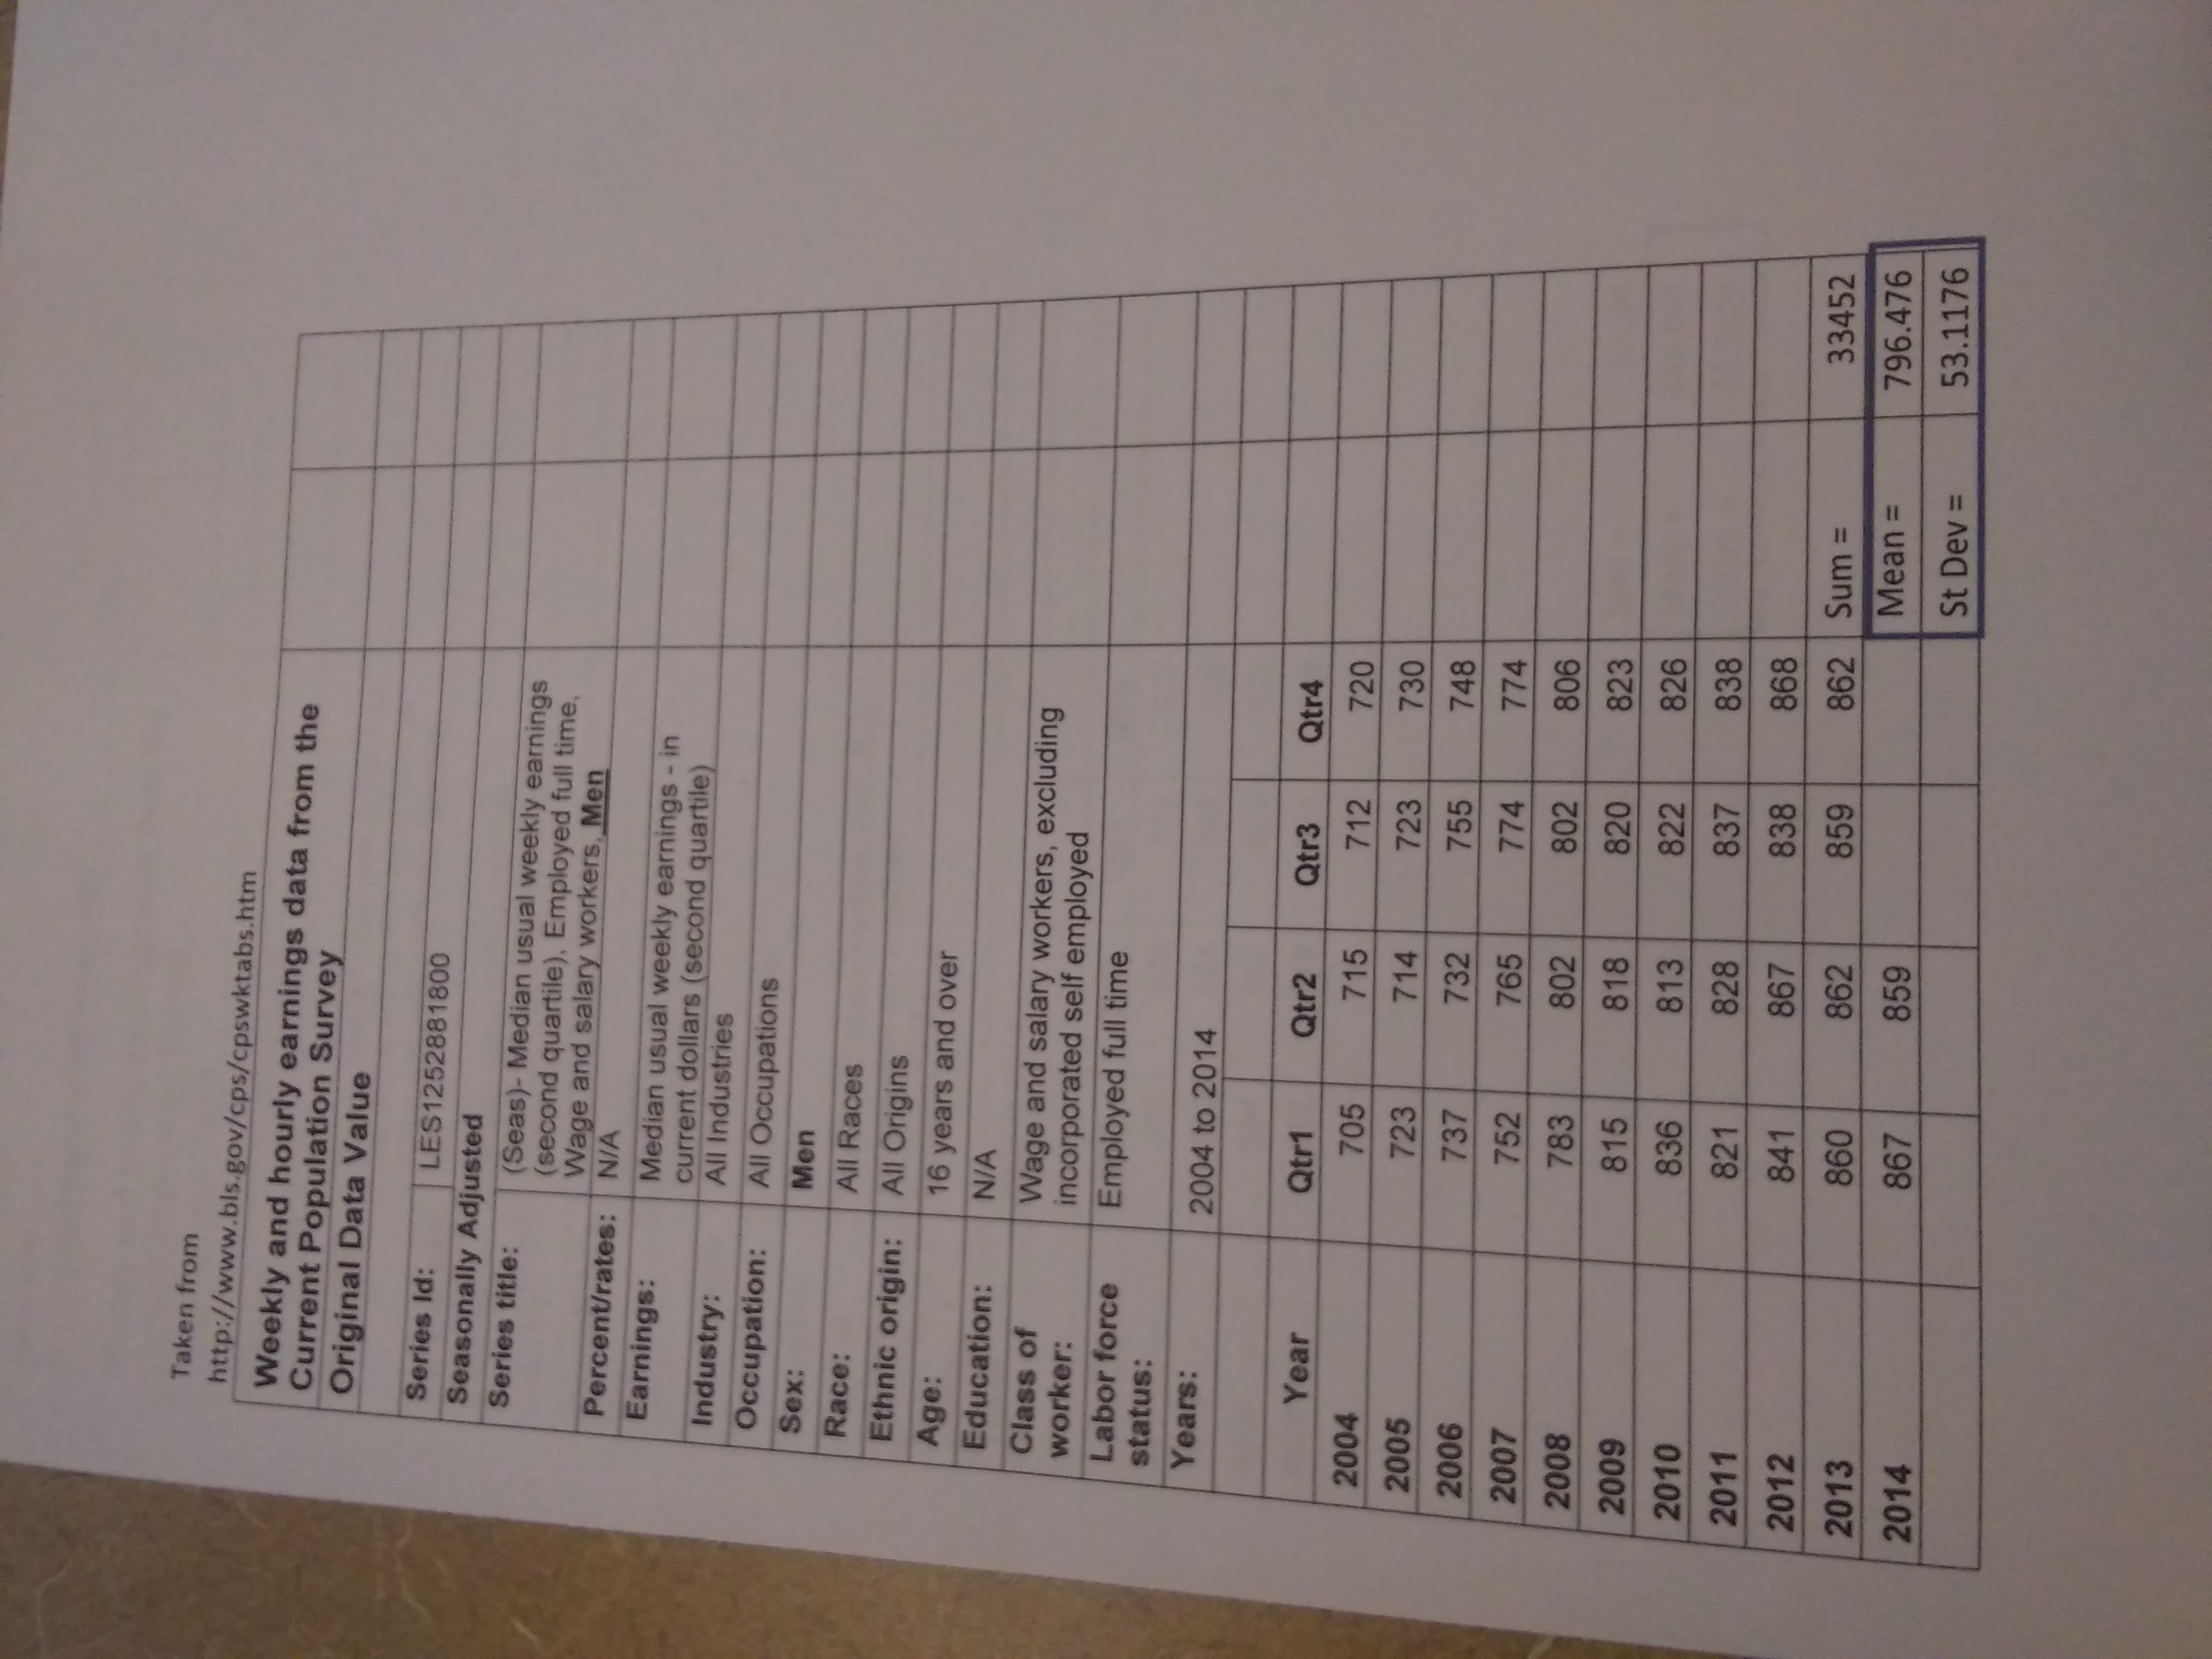
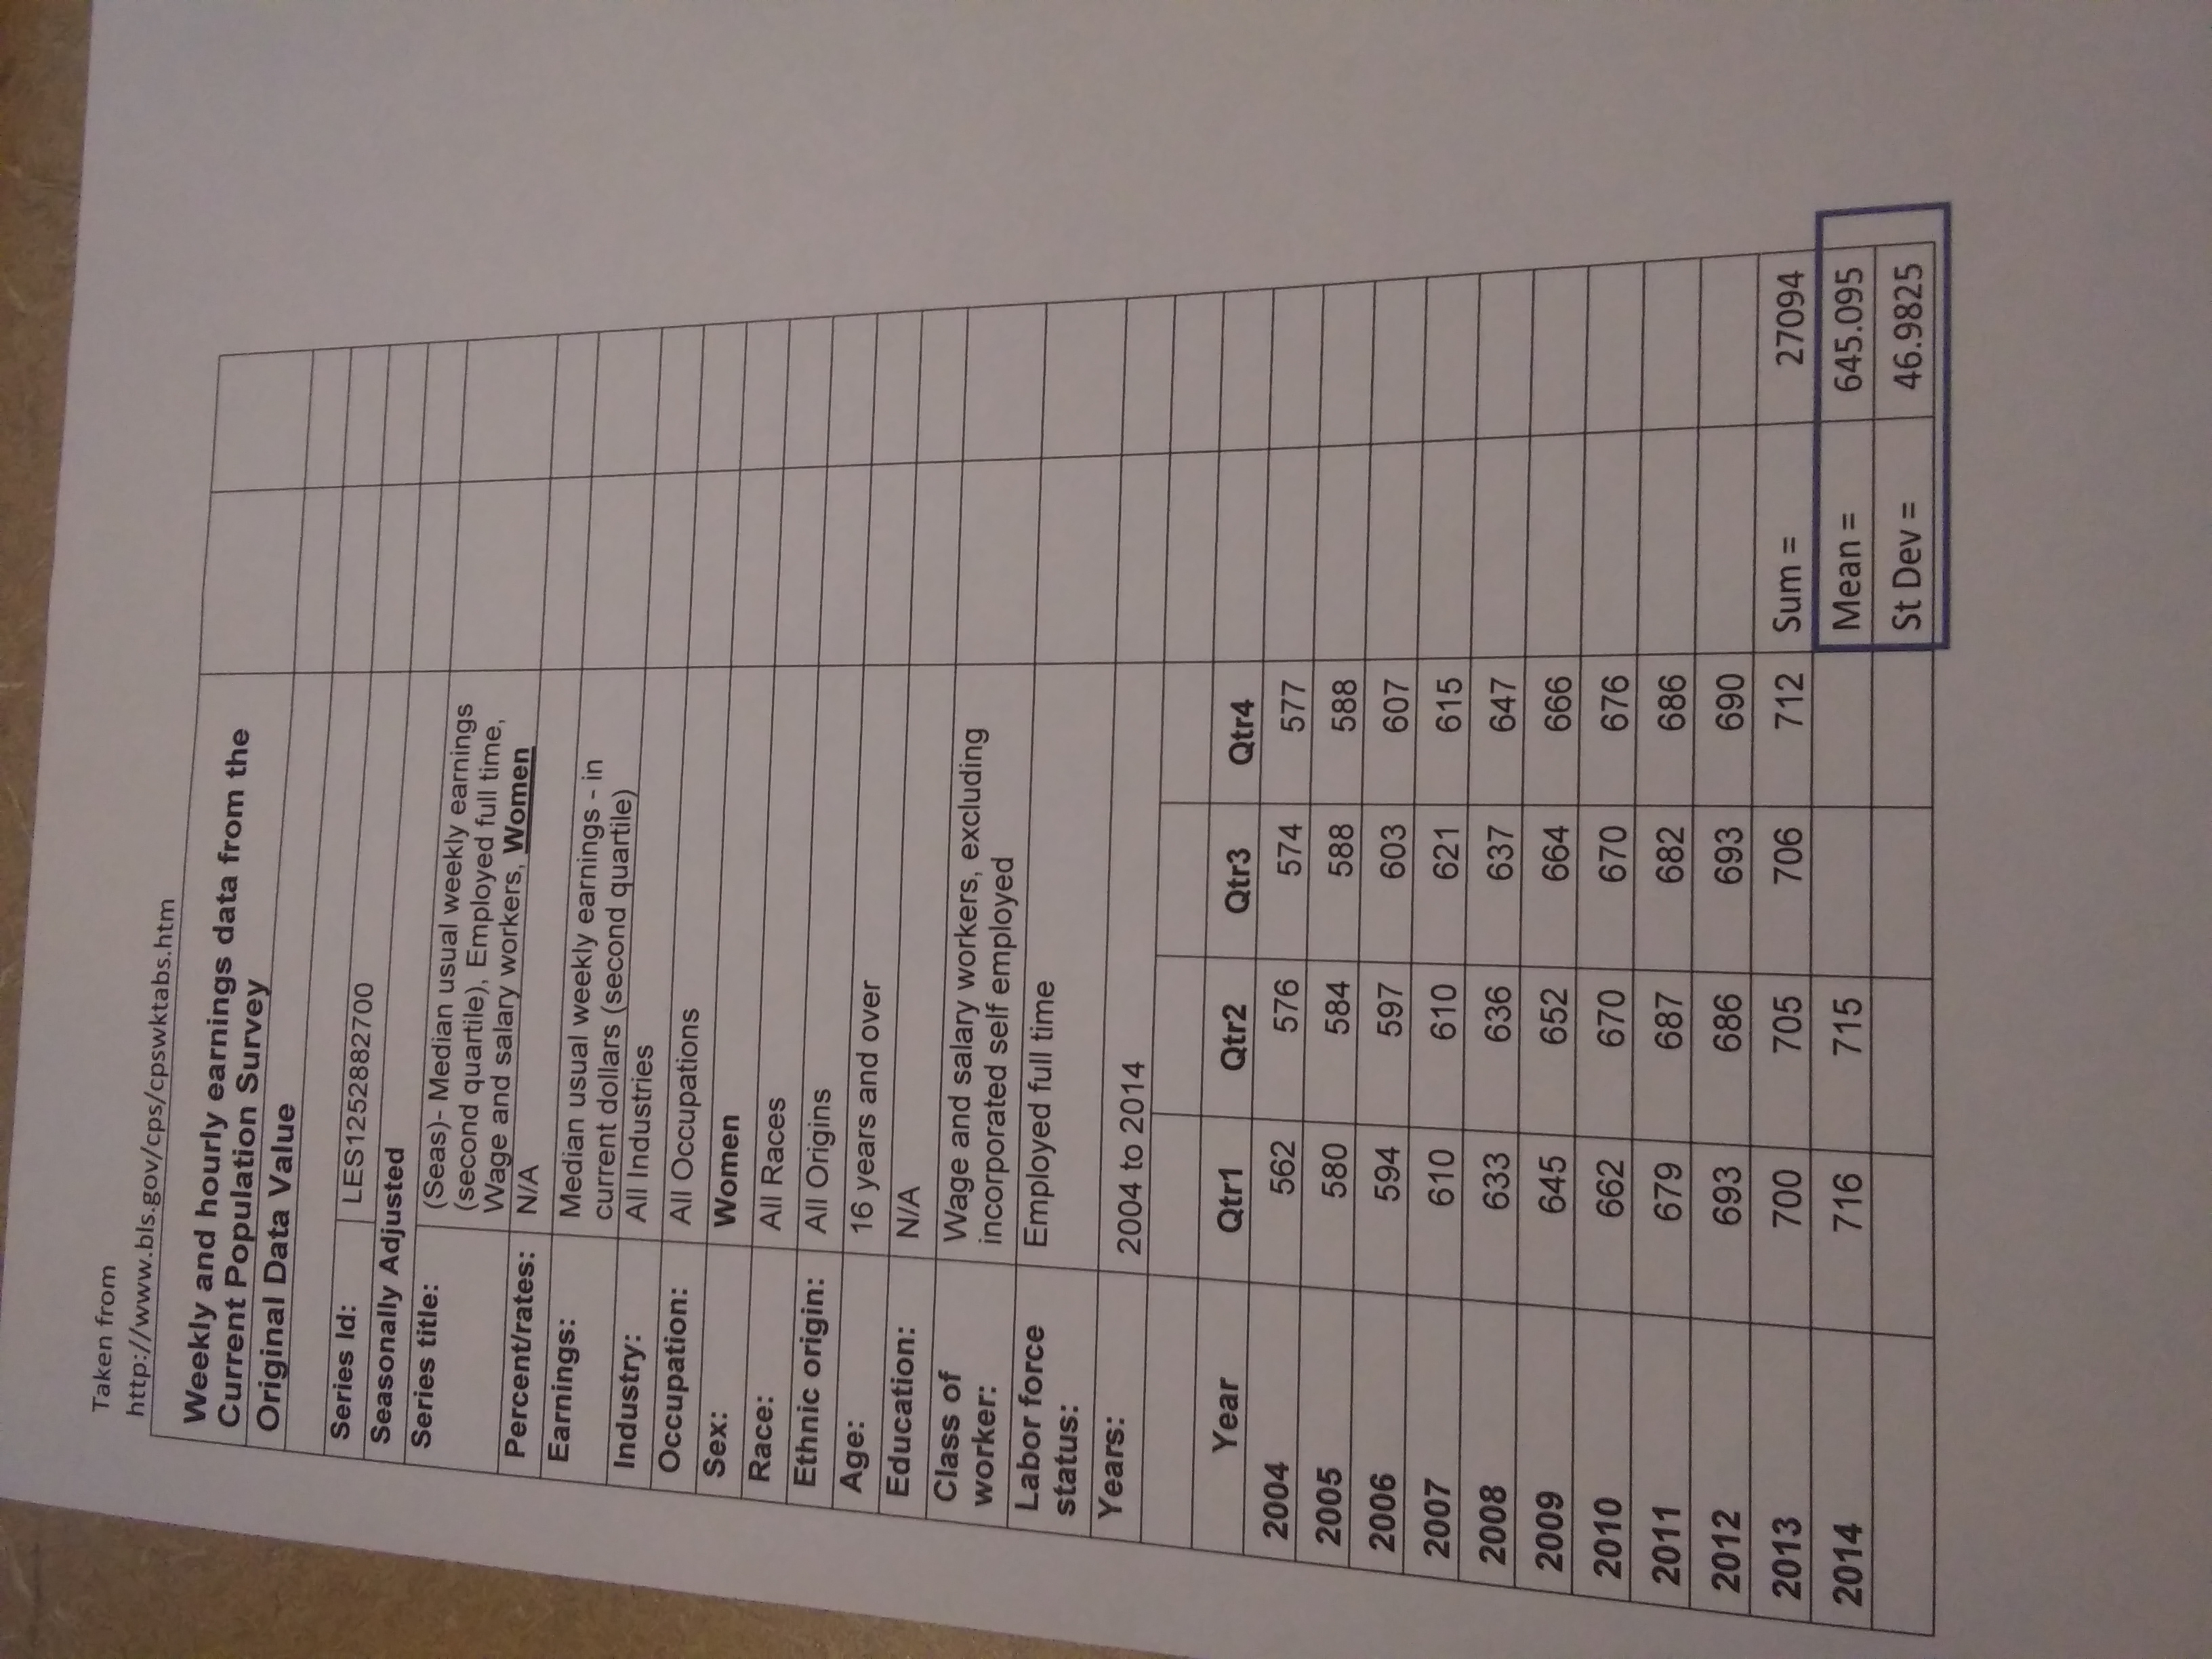
Module 4 Project ~ The Normal Probability Distribution Name Project due Date Use the tables on the following pages to answer all of the following questions about median quarterly salary of Men versus Women from 2004 to 2014. Answer all questions in percent form rounded to the nearest tenths. Use the mean and standard deviations given in the tables. You may wish to use page 349 Finding Areas under the Normal Curve. Show All Work!! 1. Find the probability that a woman that has worked for the last 10 years has had a median weekly salary greater than $600 (10 points)? 2. Find the probability that a man that has worked for the last 10 years has had a median weekly salary greater than $600 (10 points)? 3. Find the probability that a woman that has worked for the last 10 years has had a median weekly salary less than $600 (10 points)? 4. Find the probability that a man that has worked for the last 10 years has had a median weekly salary less than $700 (10 points)? 5. The 2014 poverty income yearly for an 8 family household is $40,090 yearly (http://aspe.hhs.gov/poverty/14poverty.cfm) which is about $771 weekly. a. Find the probability that a single man income household median average for the last 10 years makes this much, $771, or more (10 points). b. Find the probability that a single woman income household median average for the last 10 years makes this much or more (10 points). 6. The second quarter of 2014 women made a median weekly income of_ This is the same median income for men in the year during the quarter (10 points). 7. Determine the median man incomes that represent the middle 90% of all of the quarterly man incomes between 2004 and 2014 to the nearest dollar (10 points). 8. Determine the median woman incomes that represent the middle 90% of all of the quarterly woman incomes between 2004 and 2014 to the nearest dollar (10 points). 9. Name one reason you believe there is such a difference ($796-$645 = $151) in the average median incomes between men and women over the 10 year span (10 points).Taken from http://www.bls.gov/cps/cpswktabs.htm Weekly and hourly earnings data from the Current Population Survey Original Data Value Series Id: LES1252881800 Seasonally Adjusted Series title: (Seas)- Median usual weekly earnings (second quartile), Employed full time, Percent/rates: N/A Wage and salary workers, Men Earnings: Median usual weekly earnings - in Industry: current dollars (second quartile) All Industries Occupation: All Occupations Sex: Men Race: All Races Ethnic origin: All Origins Age: 16 years and over Education: N/A Class of worker: Wage and salary workers, excluding incorporated self employed Labor force Employed full time status: Years: 2004 to 2014 Year Qtr1 Qtr2 Qtr3 Qtr4 2004 705 715 712 720 2005 723 714 723 730 2006 737 732 755 748 2007 752 765 774 774 2008 783 802 802 806 2009 815 818 820 823 2010 836 813 822 826 2011 821 828 837 838 2012 841 867 838 868 2013 860 862 859 862 Sum = 33452 2014 867 359 Mean = 796.476 St Dev = 53.1176Taken from http://www.bls.gov/cps/cpswktabs.htm Weekly and hourly earnings data from the Current Population Survey Original Data Value Series Id: LES1252882700 Seasonally Adjusted Series title: (Seas)- Median usual weekly earnings (second quartile), Employed full time, Percent/rates: Wage and salary workers, Women N/A Earnings: Median usual weekly earnings - in current dollars (second quartile) Industry: All Industries Occupation: All Occupations Sex: Women Race: All Races Ethnic origin: All Origins Age: 16 years and over Education: N/A Class of Wage and salary workers, excluding worker: incorporated self employed Labor force Employed full time status: Years: 2004 to 2014 Year Qtr1 Qtr2 Qtr3 Qtr4 2004 562 576 574 577 2005 580 584 588 588 2006 594 597 603 60 2007 610 610 62 615 2008 633 636 637 647 2009 645 652 664 666 2010 662 670 670 676 2011 679 687 682 686 2012 693 686 693 690 2013 700 705 706 712 Sum = 27094 716 715 Mean = 645.095 2014 St Dev = 46.9825
Step by Step Solution
There are 3 Steps involved in it

Get step-by-step solutions from verified subject matter experts