

Question: MATH1210.041 Elementary Statistics (2) Staci Williams 05/19/22 2:44 PM Homework: HW 3.3 Question 4, 3.3.3 HW Score: 14.53%, 1.89 of 13 E Part 3 of
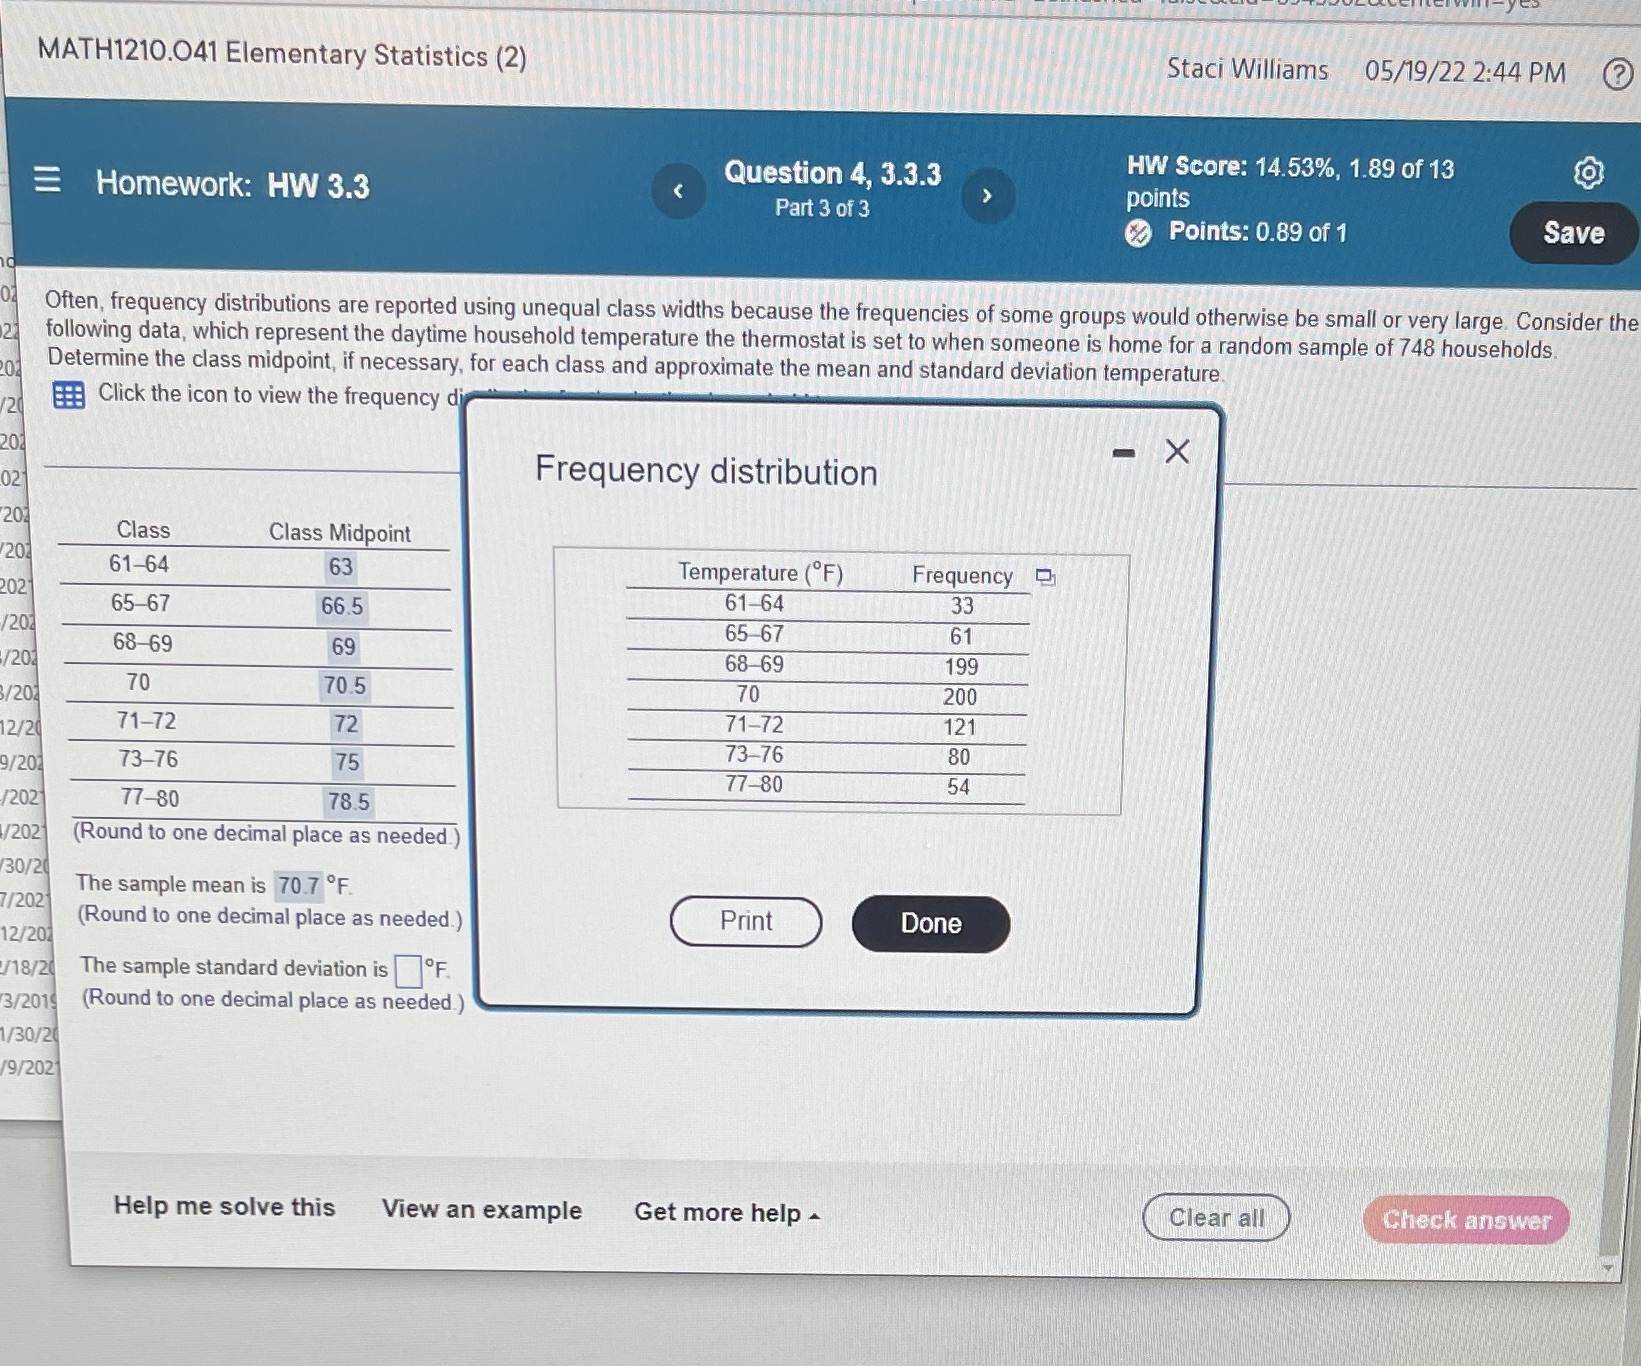
MATH1210.041 Elementary Statistics (2) Staci Williams 05/19/22 2:44 PM Homework: HW 3.3 Question 4, 3.3.3 HW Score: 14.53%, 1.89 of 13 E Part 3 of 3 points Points: 0.89 of 1 Save Often, frequency distributions are reported using unequal class widths because the frequencies of some groups would otherwise be small or very large. Consider the following data, which represent the daytime household temperature the thermostat is set to when someone is home for a random sample of 748 households Determine the class midpoint, if necessary, for each class and approximate the mean and standard deviation temperature. Click the icon to view the frequency di X Frequency distribution Class Class Midpoint 61-64 63 Temperature (OF) Frequency 65-67 66.5 61-64 33 202 65 67 61 68-69 69 201 68 69 199 70 202 70.5 70 200 2/2 71-72 72 71-72 121 73-76 75 73-76 80 /207 77-80 54 202 77-80 78.5 202 (Round to one decimal place as needed.) 130/2 The sample mean is 70.7 OF. /202 (Round to one decimal place as needed.) Print Done 12/20 /18/2 The sample standard deviation is OF. 3/2019 (Round to one decimal place as needed.) 130/2 19/202 Help me solve this View an example Get more help - Clear all Check
Step by Step Solution
There are 3 Steps involved in it

Get step-by-step solutions from verified subject matter experts