

Question: Mathematica Part 2 Color interpolation -- Create two colors, coloro and colori. These are the color endpoints. They may not be white or black. --
Mathematica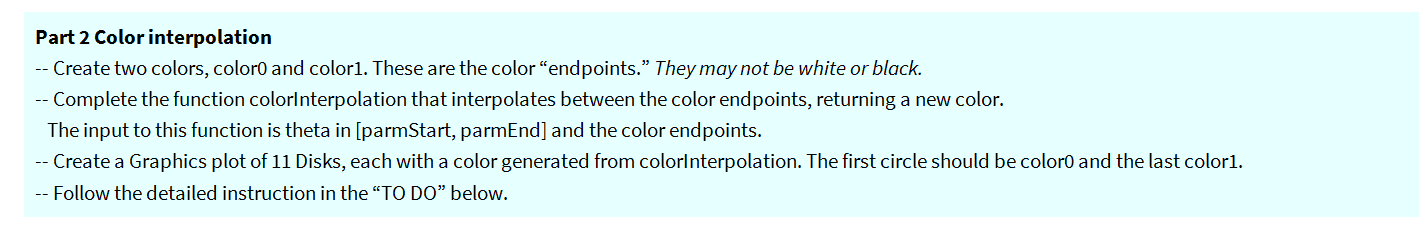
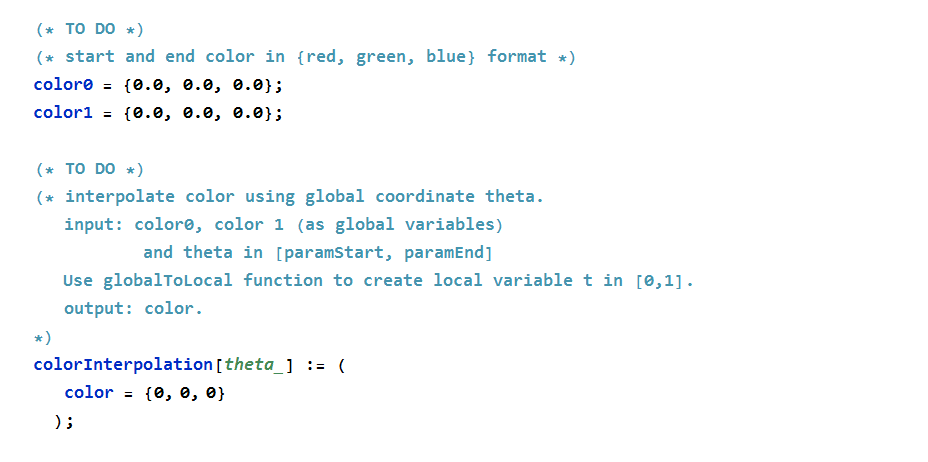
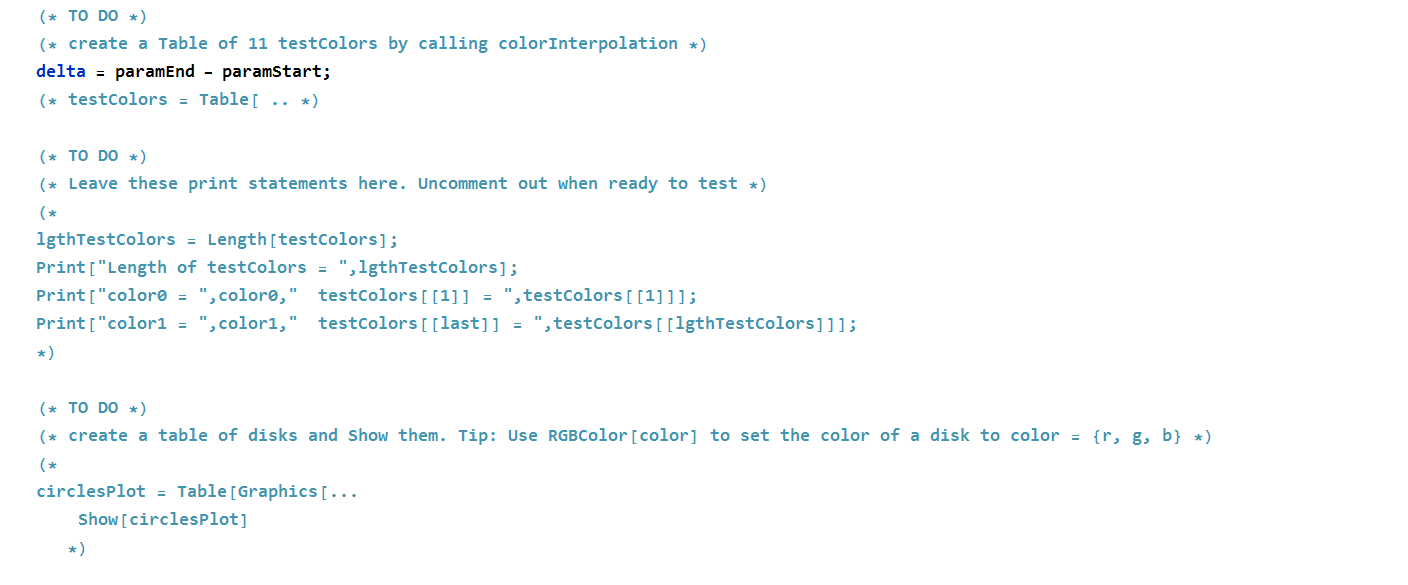
Part 2 Color interpolation -- Create two colors, coloro and colori. These are the color endpoints. They may not be white or black. -- Complete the function colorInterpolation that interpolates between the color endpoints, returning a new color. The input to this function is theta in (parmStart, parmEnd) and the color endpoints. -- Create a Graphics plot of 11 Disks, each with a color generated from colorlnterpolation. The first circle should be coloro and the last colori. -- Follow the detailed instruction in the "TO DO" below. (* TO DO *) (* start and end color in {red, green, blue} format *) coloro = {0.0, 0.0, 0.0}; color1 = {0.0, 0.0, 0.0}; (* TO DO *) (* interpolate color using global coordinate theta. input: coloro, color i (as global variables) and theta in [paramstart, paramEnd] Use globalToLocal function to create local variable t in [0,1]. output: color. colorInterpolation[theta_] := ( color = {0, 0, 0} ); (* TO DO *) (* create a Table of 11 testcolors by calling color Interpolation *) delta = paramEnd - paramstart; (* testcolors = Table[ .. *) (* TO DO *) (* Leave these print statements here. Uncomment out when ready to test *) (* 1gthTestcolors = Length[testcolors]; Print["Length of testcolors = ", lgthTestcolors]; Print["coloro = ", coloro," testcolors [[1]] = ", testcolors[[1]]]; Print["color1 = ",colori," testcolors [[last]] = ", testcolors [[lgthTestcolors]]]; (* TO DO *) (* create a table of disks and show them. Tip: Use RGB Color[color] to set the color of a disk to color = {r, g, b} *) circlesPlot = Table [Graphics [... Show [circlesplot] *) Part 2 Color interpolation -- Create two colors, coloro and colori. These are the color endpoints. They may not be white or black. -- Complete the function colorInterpolation that interpolates between the color endpoints, returning a new color. The input to this function is theta in (parmStart, parmEnd) and the color endpoints. -- Create a Graphics plot of 11 Disks, each with a color generated from colorlnterpolation. The first circle should be coloro and the last colori. -- Follow the detailed instruction in the "TO DO" below. (* TO DO *) (* start and end color in {red, green, blue} format *) coloro = {0.0, 0.0, 0.0}; color1 = {0.0, 0.0, 0.0}; (* TO DO *) (* interpolate color using global coordinate theta. input: coloro, color i (as global variables) and theta in [paramstart, paramEnd] Use globalToLocal function to create local variable t in [0,1]. output: color. colorInterpolation[theta_] := ( color = {0, 0, 0} ); (* TO DO *) (* create a Table of 11 testcolors by calling color Interpolation *) delta = paramEnd - paramstart; (* testcolors = Table[ .. *) (* TO DO *) (* Leave these print statements here. Uncomment out when ready to test *) (* 1gthTestcolors = Length[testcolors]; Print["Length of testcolors = ", lgthTestcolors]; Print["coloro = ", coloro," testcolors [[1]] = ", testcolors[[1]]]; Print["color1 = ",colori," testcolors [[last]] = ", testcolors [[lgthTestcolors]]]; (* TO DO *) (* create a table of disks and show them. Tip: Use RGB Color[color] to set the color of a disk to color = {r, g, b} *) circlesPlot = Table [Graphics [... Show [circlesplot] *)
Step by Step Solution
There are 3 Steps involved in it

Get step-by-step solutions from verified subject matter experts