

Question: Math-K300 Spring 2022 Online Homework: Section 9.2 Linear Regression Question 9, 9.2.38 HW Score: 75.44%, 14.33 of 19 points Part 1 of 3 Points: 0
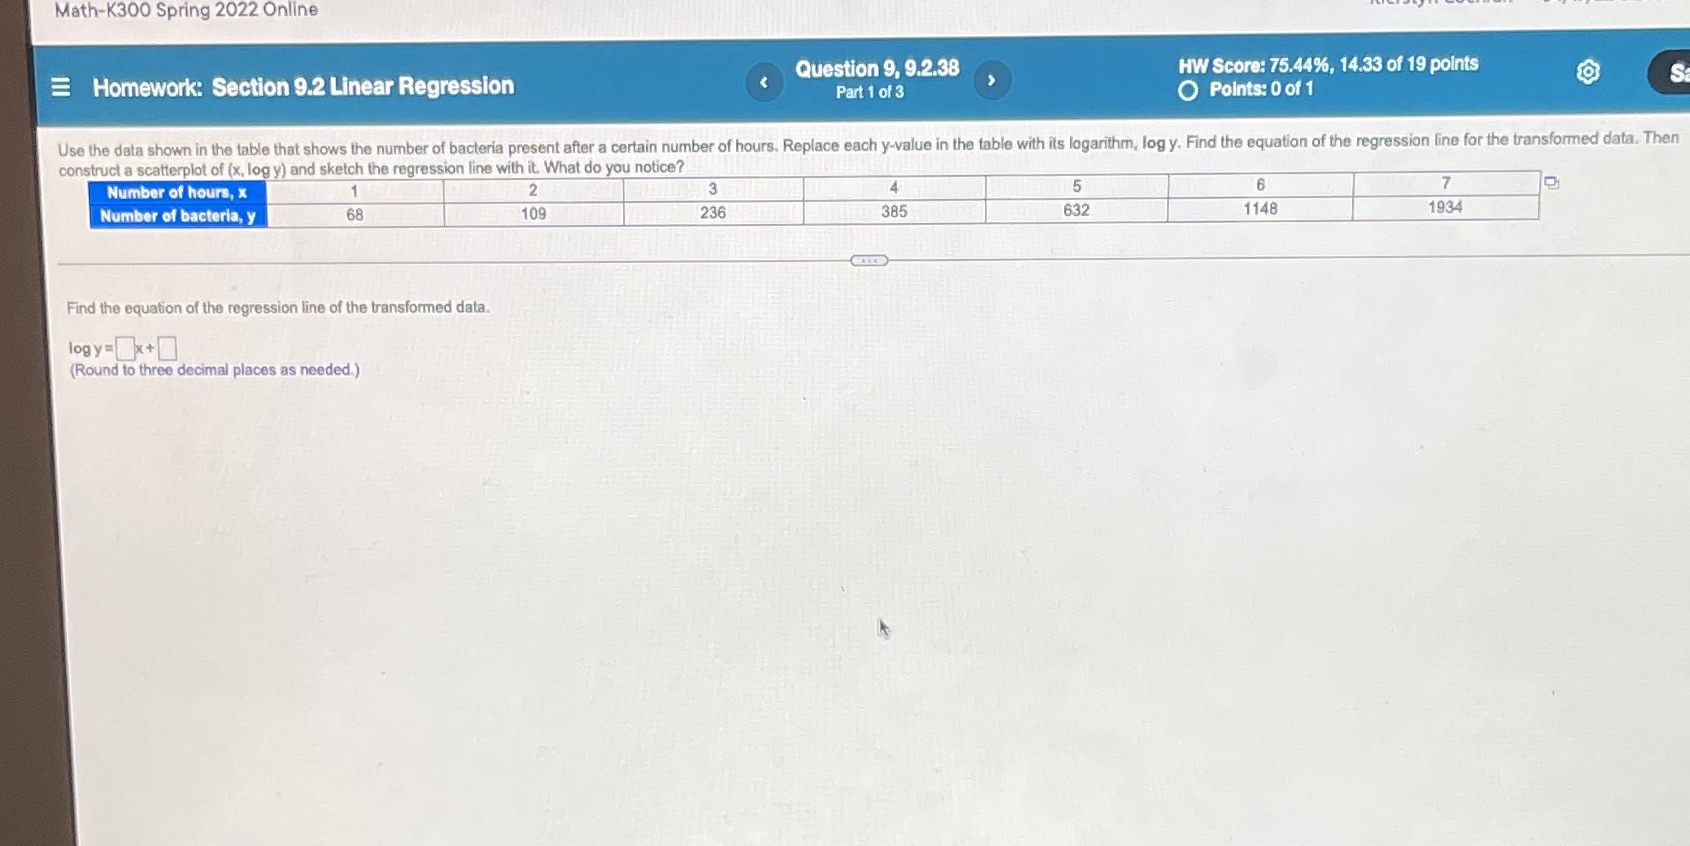
Math-K300 Spring 2022 Online Homework: Section 9.2 Linear Regression Question 9, 9.2.38 HW Score: 75.44%, 14.33 of 19 points Part 1 of 3 Points: 0 of 1 S Use the data shown in the table that shows the number of bacteria present after a certain number of hours. Replace each y-value in the table with its logarithm, log y. Find the equation of the regression line for the transformed data. Then construct a scatterplot of (x, logy) and sketch the regression line with it. What do you notice? Number of hours, x 2 3 4 5 6 7 Number of bacteria, y 68 109 236 385 632 1148 1934 Find the equation of the regression line of the transformed data. logy = x+ (Round to three decimal places as needed.)
Step by Step Solution
There are 3 Steps involved in it

Get step-by-step solutions from verified subject matter experts