

Question: mathlab Familiarize yourself with the subplot and hold command. Using the subplot and plot commands, plot the volume of a sphere as a function of
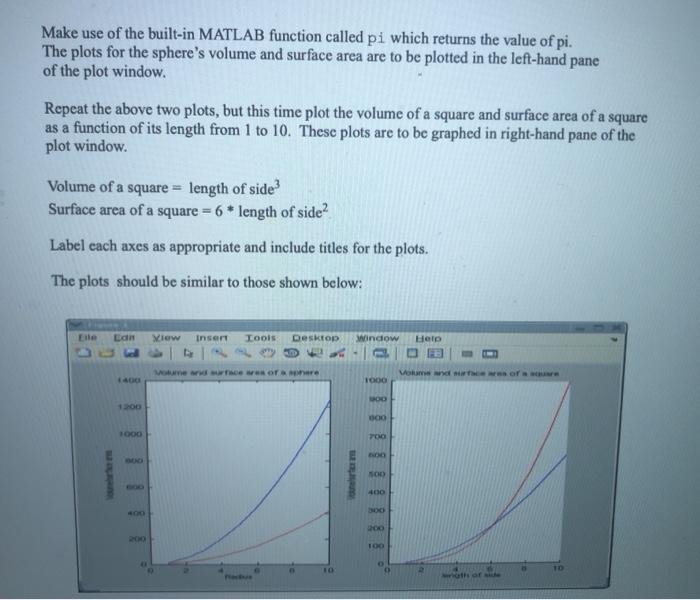
Familiarize yourself with the subplot and hold command. Using the subplot and plot commands, plot the volume of a sphere as a function of it's radius for values of radius from 1 to 10. On the same graph plot the surface area of a sphere as a function of the radius (from radius 1 to 10). Use different colors for the two plots ( help plot will give details on how to select colors) Use the following formulas: Volume of sphere = ( 4/3) * pi * radius Surface area of a sphere = 4 * pi * radius? Make use of the built-in MATLAB function called pi which returns the value of pi. The plots for the sphere's volume and surface area are to be plotted in the left-hand pane of the plot window. Repeat the above two plots, but this time plot the volume of a square and surface area of a square as a function of its length from 1 to 10. These plots are to be graphed in right-hand pane of the plot window. Volume of a square = length of side? Surface area of a square = 6 * length of side? Label cach axes as appropriate and include titles for the plots. The plots should be similar to those shown below: Lain View Inser Tools Desktop window Help 1000 1000 POO 400 as of
Step by Step Solution
There are 3 Steps involved in it

Get step-by-step solutions from verified subject matter experts