

Question: mathlab question: Write a function called sales_stats that takes two inputs: sales, an n-by-m matrix, and prices, a row vector with m elements. Each row
mathlab question:
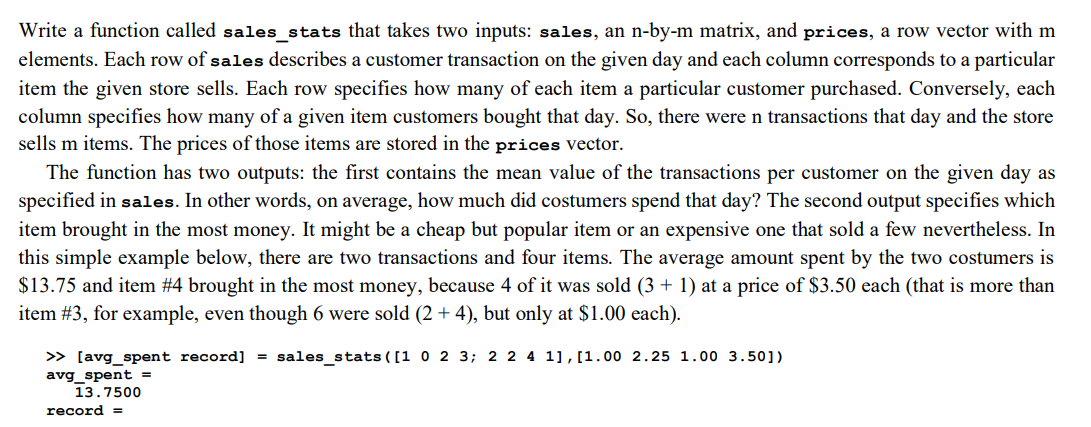
Write a function called sales_stats that takes two inputs: sales, an n-by-m matrix, and prices, a row vector with m elements. Each row of sales describes a customer transaction on the given day and each column corresponds to a particular item the given store sells. Each row specifies how many of each item a particular customer purchased. Conversely, each column specifies how many of a given item customers bought that day. So, there were n transactions that day and the store sells m items. The prices of those items are stored in the prices vector. The function has two outputs: the first contains the mean value of the transactions per customer on the given day as specified in sales. In other words, on average, how much did costumers spend that day? The second output specifies which item brought in the most money. It might be a cheap but popular item or an expensive one that sold a few nevertheless. In this simple example below, there are two transactions and four items. The average amount spent by the two costumers is $13.75 and item #4 brought in the most money, because 4 of it was sold (3 + 1) at a price of $3.50 each (that is more than item #3, for example, even though 6 were sold (2 + 4), but only at $1.00 each). >> [avg_spent record] = sales_stats([1 0 2 3; 2 2 4 1],[1.00 2.25 1.00 3.50]) avg_spent = 13.7500 record =
Step by Step Solution
There are 3 Steps involved in it

Get step-by-step solutions from verified subject matter experts