

Question: MATHSWeather & Climate GraphsQuestion 1:Refer to the climate graph below and answer the questions which follow:Average Annual rainfall and temperatures of Stellenbosch, SA70140130130120120110113-116100904080Max termperatures in
MATHSWeather & Climate GraphsQuestion 1:Refer to the climate graph below and answer the questions which follow:Average Annual rainfall and temperatures of Stellenbosch, SA70140130130120120110113-116100904080Max termperatures in degrees Celsius7670Rainfall measured in mm3060625550204036302829102021181000123456789101112Months of the year? Max TempRainfall1.1In which month/s were the highest maximum temperatures recorded?(2)1.2In which month/s were the lowest rainfall recorded?(1)1.3What is the difference between the highest and lowest rainfall recorded?(2)1.4Temperatures above 20C is recorded betweenand(2)1.5Give two months in which the average annual temperatures recorded were the same. (2)
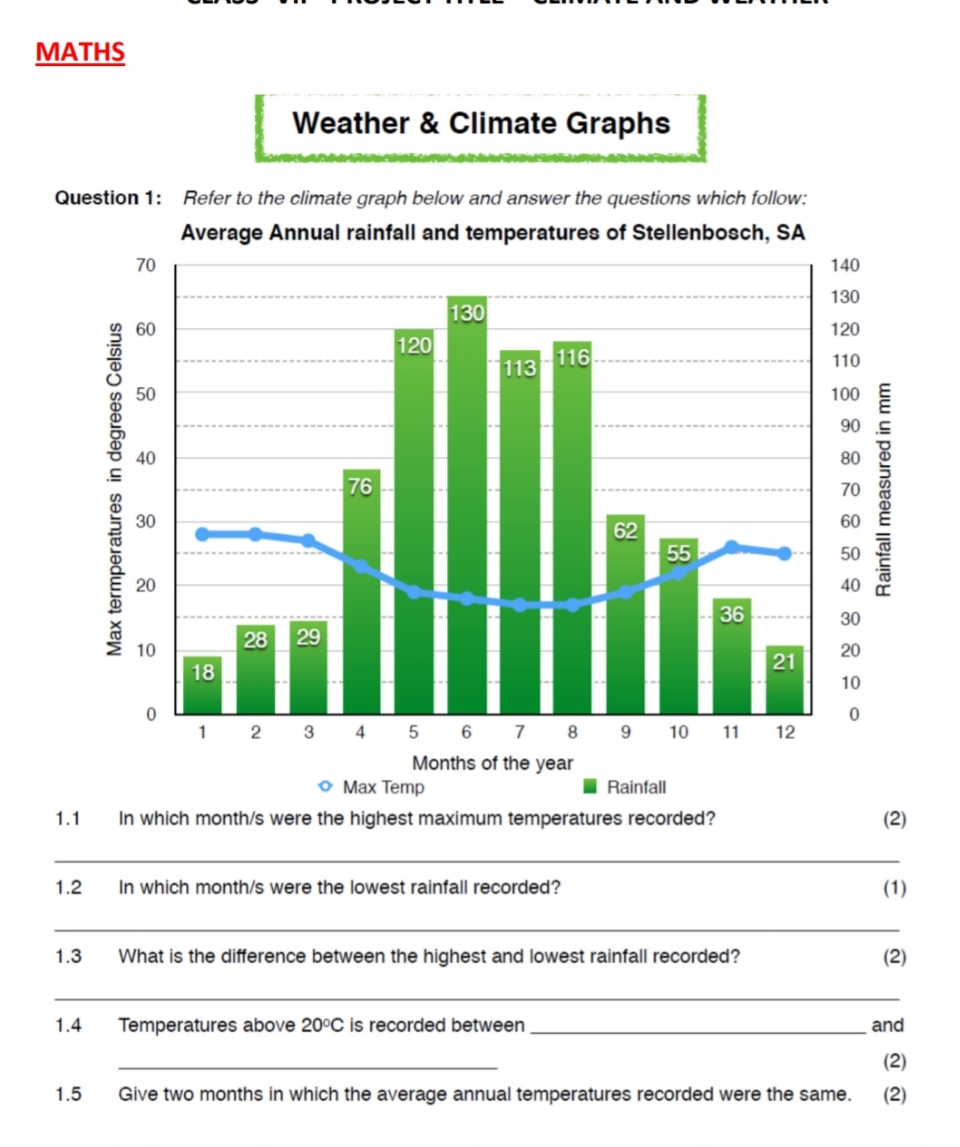
MATHS Weather & Climate Graphs Question 1: Refer to the climate graph below and answer the questions which follow: Average Annual rainfall and temperatures of Stellenbosch, SA 70 140 130 130 60 120 120 113 116 110 50 40 76 6 8 8 8 8 8 8 Rainfall measured in mm Max termperatures in degrees Celsius 30 62 55 20 36 30 28 29 10 21 20 18 10 0 1 2 3 4 5 6 7 8 9 10 11 12 Months of the year Max Temp Rainfall 1.1 In which month/s were the highest maximum temperatures recorded? (2) 1.2 In which month/s were the lowest rainfall recorded? (1) 1.3 What is the difference between the highest and lowest rainfall recorded? (2) 1.4 Temperatures above 20C is recorded between and (2) 1.5 Give two months in which the average annual temperatures recorded were the same. (2)
Step by Step Solution
There are 3 Steps involved in it

Get step-by-step solutions from verified subject matter experts