

Question: & mathxl.com OU+0 M In M P Section 10.1 P Course Home - Monica Kpedenou Do Homework - Homework 10 P Do Homework - Homework
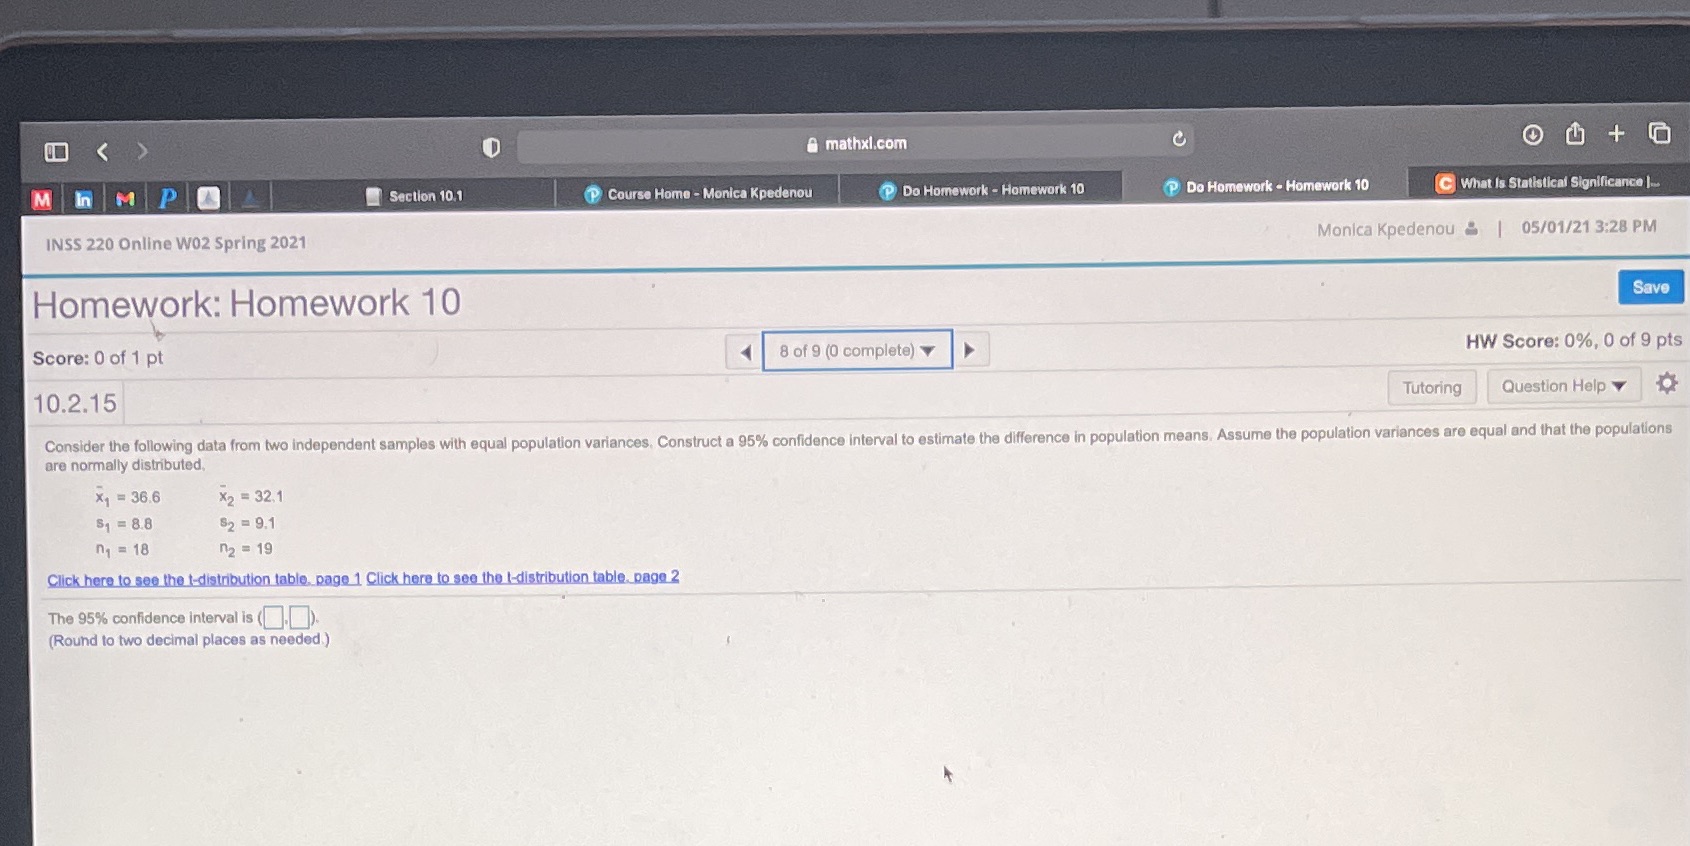
& mathxl.com OU+0 M In M P Section 10.1 P Course Home - Monica Kpedenou Do Homework - Homework 10 P Do Homework - Homework 10 C What Is Statistical Significance |.. INSS 220 Online W02 Spring 2021 Monica Kpedenou & | 05/01/21 3:28 PM Homework: Homework 10 Save Score: 0 of 1 pt 8 of 9 (0 complete) HW Score: 0%, 0 of 9 pts 10.2.15 Tutoring Question Help Consider the following data from two independent samples with equal population variances, Construct a 95% confidence interval to estimate the difference in population means, Assume the population variances are equal and that the populations are normally distributed X1 = 36.6 X2 = 32.1 $1 = 8.8 $2 = 9.1 n1 = 18 n2 = 19 Click here to see the t-distribution table, page 1 Click here to see the I-distribution table. page 2 The 95% confidence interval is (].). (Round to two decimal places as needed.)
Step by Step Solution
There are 3 Steps involved in it

Get step-by-step solutions from verified subject matter experts